Think Tanker’s Data ToolBox
I’m in Prague at the Policy Research, Technology and Advocacy Event @ the Hub, run by Open Society Foundations Think Tank Fund. It’s a fascinating event with some of Europe’s best Think Tank minds; I had the pleasure of helping them work through tools that can help them to troubleshoot some of the issues they face in their day to day work.
So which tools should be in the Think Tankers Data Toolbox?
There are many excellent curated lists of tools useful for policy research, analysis and visualisation, which seem to be the most interesting topics here. Here’s just a few:
- See the School of Data – Favourite Resources for some of our favourites in Getting, Cleaning, Analysing, Presenting & Sharing Data. (See shot below)

* The On Think Tanks blog has a great list of visualisation resources
* Digital Methods Toolkit from the Digital Methods Initiative.
Let’s look at the specific problems the group raised and what tools we know to help with them!
Getting Data: “What’s the best tool for conducting an online survey?”
The results of a great #groupthink from the room, who knew many options I’d never heard of – here’s what they came up with/ In no particular order:
- Survey Monkey
- LimeSurvey
- Umfrage online
- Qualtrics
- QuestionForm
- Google Docs (see “forms”)
- Question Pro
- SurveyGizmo
- SoGoSurvey
- FluidSurvey
- Stellar survey
- Adobe tools
- Survey factory
- Checkbox
- Cvent
- Objectplanet.com
- Instant survey
- New addition 8/11/2013 via @@shoha99 Survey Sidekick
- New addition 20/11/2013 via @zararah All our ideas
Special thanks to Dora Hardy from Open Society Foundations for this list!
Keen to hear from you which is the best – please feel free to drop comments in the section below.
Getting Data: “My government doesn’t give me data!”
Try asking publicly! Check out online Freedom of information sites on the web such as AsktheEU. Many countries also have their own sites!
Tip: Want to see examples of how people have ensured they get machine-readable data (i.e. spreadsheets not PDFs) from Freedom of Information request. See this successful example of asking for the EU budget to see what to ask for!
Extracting Data: “My data is trapped in a PDF! Help!”
We focussed today on Tabula – a great tool which allows you to highlight tables in a PDF and extract them as CSV files. Unfortunately, it struggled with a Cyrillic copy of the Serbian Gazette, but here’s hoping that future updates will help to support other character sets.
Want more information about other options? Try the School of Data course on PDF extraction
Cleaning Data: “Are there any tools to automatically assess data quality?”
Getting into potentially dangerous territory here, however, one suggestion was made. Open Studio, by Talend – I don’t have experience with it myself, but again – any testimonials from personal experience, please drop them in the comments box.
Analysing Data: “I have huge volumes of documents and don’t know where to start”.
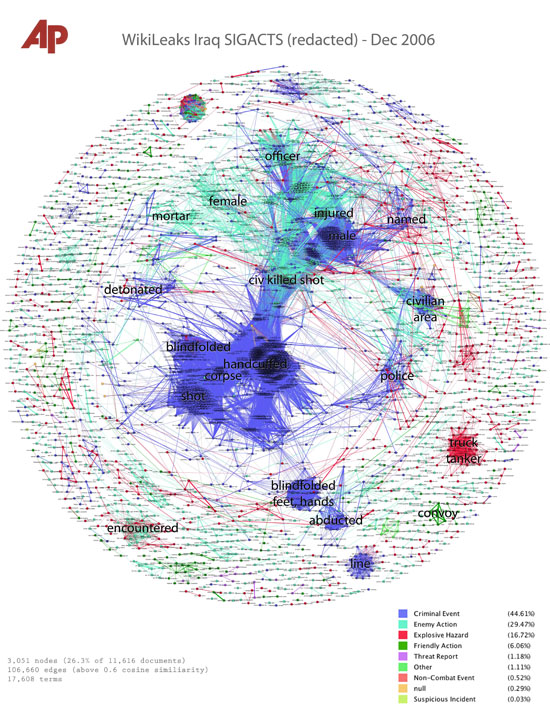
Projects such as Document Cloud allow you to upload and search lots and lots of documents (even PDFs). Check out also The Overview Project for an example of a tool which helps to visualise common topics in a big dump of documents and links between themes in documents. Below: visualisation of the Wikileaks War Logs: Large Words = commonly occurring words, Points = Documents, Lines = show which documents connected to the topics.

Overview, by the Associated Press
Analysing Data: “Do you have a primer for network analysis?”
Sure do! Check out this quick guide – we promise to update it soon to take account of new changes to the Twitter API.
What else we showed.
The final part of the workshop was dedicated to a quick session on Geocoding. Using a Google Spreadsheet and using some highly refined copy and paste skills from the School of Data tutorial on Geocoding, we created a beautiful TileMill map in the themed colours of ExpertForum.
If you want to get a map in your themed colours, you’ll need a colour capturer to grab your organisation’s colours. I used “Hues”, available in the App Store, but there are lots of options available.
Black magic
After the session, I showed a couple of people how to get data out of tables online where copy-paste doesn’t work. Check out the School of Data tutorial on IMPORTHTML if you have similar problems!
Final plug
Thinking of entering the On Think Tanks Datavis competition? Check out these guidelines by, School of Data Advisory board member, Gregor Aisch (DrivenByData) to avoid committing a visualisation faux-pas.
Submissions for the On Think Tanks Data Visualisation Competition close on 20th November. Get your submission in now!
Enjoyed this? Want to stay in touch? Join the School of Data Announce Mailing List for updates on more training activities from the School of Data.

