You are browsing the archive for Marco Túlio Pires.

Meet the 2016 School of Data Fellows!

- May 7, 2016 in Announcement, Community, Fellowship

Alt text
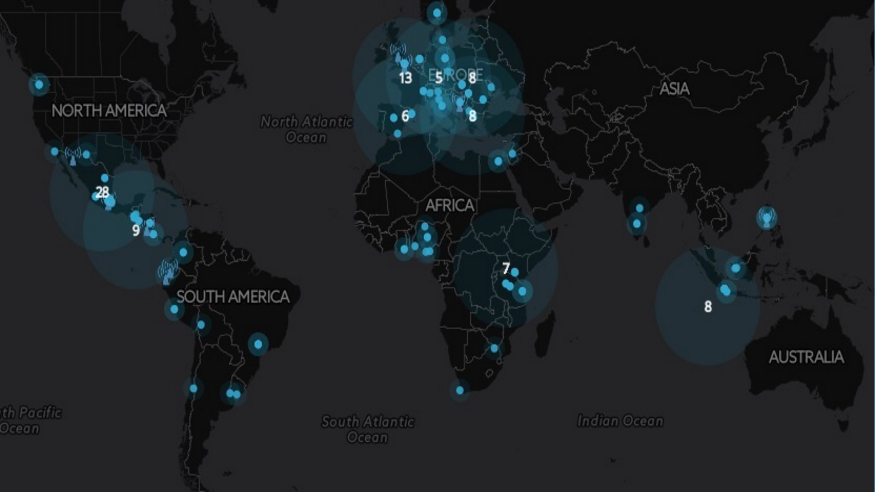
For the past three years, School of Data has been identifying and selecting outstanding data-literacy practitioners around the world. Our Fellows have led the way in bringing data-literacy knowledge and practices to their region: 26 individuals in 25 different countries in regions right across Latin America, Europe, Africa and Asia.

When we set out to revamp the Fellowship Programme in 2016, we challenged ourselves to involve other organisations that care as deeply about data literacy as we do. Bringing together our networks and expertise, we designed a bold new programme, organised in four data-literacy related areas: Data Journalism, Extractives Industries, Responsible Data and fellows’ “Own Focus”. In this way, we aim for School of Data to become a data-literacy hub, creating spaces in which both organisations and local leaders will engage with data literacy in new and exciting ways.

We are very proud to announce our School of Data Fellowship Class of 2016. We have reviewed 736 applications from 102 different countries. Our team worked around the clock to coordinate interviews across multiple timezones and our partner organisations and funders played a definitive role in identifying the best candidates.

We couldn’t be more happy with this class and we are sure they will make a huge splash in their respective regions! Here are the new School of Data fellows:

Nika Aleksejeva, Latvia

Alt text

Nika is a passionate data storyteller from Latvia. In 2013, she joined Infogr.am, a popular data visualization service that empowers non-designers to create beautiful data visualizations in no time. In 2014, she launched the international Infogram Ambassador Network that unites ~100 data enthusiasts all over the world. Each of them brings the power of data visualisation to local communities worldwide. Nika comes from a journalism background – her work involved writing about business topics and data-driven stories about energetics, global economic trends and education. Seeing the future in digital journalism, she continues to work and share the knowledge that helps to develop new communication forms. Currently she works to empower Latvian journalists with data journalism skills by curating School of Data in Latvia.

She will join the Data Journalism track to empower data-literacy activities with Journalists in Latvia

Precious ONAIMO, Nigeria

Alt text

Precious is a software developer and a technology enthusiast with the belief that people can only live better if they are provided with accurate, reliable and easy-to-access data, and tools that enable them to make real-time, qualitative and informed decisions. He was the Deputy Head of Software Development in iDevWorks Nigeria Limited, where he worked on designing, development and maintenance of many industry enterprise resource planning solutions geared towards eradicating the unavailability, insecurity, errors and delays associated with manual collation and distribution of organizational data and workflows. He currently heads a team of six programmers to develop open data solutions in different sectors, such as agriculture and extractives industries.

He will join the Extractives Data track and will work with the Nigerian team at the Natural Resources Governance Institute

Vadym Hudyma, Ukraine

Alt text

Vadym Hudyma is an open data activist and works as digital security consultant for CSOs and activist groups in Kiev, Ukraine. He was involved in several projects focused on government, electoral and parliamentary transparency in Ukraine. It included mass screening tens of thousands of candidates in Parliament and local elections for their involvement in corruption crimes or human rights violation activities. He also worked on the launch of an extensive database of firms and individuals mentioned as suspects in anti-corruption journalist investigations in Ukraine. One of his main activities was devising policy on disclosure procedures. As a security specialist, he’s helping raise and spread awareness in basic digital security problems as well as privacy issues in digital age. He also helps young non-governmental organizations in devising their information security policies, as well as contributes as a trainer to journalists and activists working in the war zone in Eastern Ukraine and in annexed Crimea.

He will join the Responsible Data track and will be working with The Engine Room

Malick LINGANI, Burkina Faso

Alt text

Malick Lingani is a Social Entrepreneur from Burkina Faso. He is committed to improving Transparency and Accountability through the advancement of Data Literacy within organizations, institutions and media. He is the Co-founder of the Ouagadougou-based NGO BEOG-NEERE.Org (For a better future) where he works as a data scientist and also as mentor to empower youth in the development of innovative and sustainable startups in sub-Saharan Africa since 2012. Malick holds a Master in Computer Sciences and Business development from the University of Ouagadougou and also a Data Science Specialization from John Hopkins University.

He will join the Extractives Data track and will work with the Natural Resources Governance Institute

Kabukabu MUHAU, Zambia

Alt text

Kabukabu Muhau is a researcher and statistician specialised in demography and economics. She has worked with the NGO Coordinating Council (NGOCC) as Monitoring and Evaluation assistant. Currently, she works for the National Youth Development Council as a Hub Officer, assisting youths in her province to access information more easily. Having studied Health Demography, she developed a keen interest in the Health sector of Zambia. She’s particularly interested in strengthening her country’s current Health Information Management System so that it yields desired results. Her future plans include pursuing a Master’s degree in Public Health so as to strengthen her knowledge on the health sector.

She will join the “Own Focus” track working with the School of Data team in Health Data

Raisa Valda Ampuero, Bolivia

Alt text

Raisa is passionate about the impact of new technologies and social networks in the social justice field. She started working as a Community Manager in the “SerBolivianoEs” campaign, led by UNDP in Bolivia, the first Bolivian digital campaign. Raisa was logistics coordinator in encounters for a more inclusive and participatory Bolivian digital space, “Conectándonos I – II”, funded by Global Voices and Hivos, in which indigenous communities, LGBT groups, women’s associations among others participated. Raisa also worked as Social Media Strategist of the digital platform “La Pública” project promoted by Hivos, that opens and manages spaces for active citizenship through social networks and outside them; she is an Open Data activist with Bolivian projects “Cuántas Más” and “Que no te la charlen””, the last one winner of Bolivia’s First Accelerator of Data Journalism.

She will join the “Own Focus” track working with the SocialTIC and the School of Data team with Gender Data

Daniel Villatoro, Guatemala

Alt text

Daniel Villatoro started working as a journalist in Plaza Pública, an online media dedicated to do in depth journalism. There, he has worked in the Maps and Data section of the newspaper, as an investigative reporter and in other data driven projects. He graduated from Plaza Publica’s two year training program in 2014. His work has also been featured in other media like El Faro and Data Politica (El Salvador), Fáctico and Animal Politico (México) and Ojoconmipisto —a project about local corruption reporting in Guatemala’s municipalities—. He has a taste for maps, so he publishes some and tries to travel others. In 2014 he was part of the group that investigated the way the guatemalan government hid the deaths of kids who died due to malnutrition by analysing a database with all the death records of the country. In 2015 he did a series about political party financing by researching all the financial record data from the top three presidential candidates.”

He will join the Data Journalism track working with the SocialTIC team to bring data literacy to journalists in Central America

Ximena Villagrán, Guatemala

Alt text

Ximena studied journalism in Guatemala and then a master’s degree in data and investigative journalism at El Mundo newspaper in Madrid, Spain. She’s currently working as a data reporter in Guatemala. Her beginning at data journalism was at the independent media outlet, Plaza Pública, where she discovered the power of data journalism to tell stories and began to learn more about it. By now she is exploring the power of open data and information access laws to create journalism tools available to all kind of people in Guatemala. Also, she is creating a model to include data journalism and visualizations in breaking news. In 2015, she worked at the data journalism unit of El Confidencial, Spain, where she learned about how to integrate a small data journalism unit into a traditional web newspaper. She also teaches data journalism at Universidad del Istmo in Guatemala, that has the best journalism school in the country.

She will join the Data Journalism track working with Internews and SocialTIC teams to bring data literacy to journalists in Central America

Omar Luna, El Salvador

Alt text

Omar studied Social Communication at the Universidad Centroamericana “Jose Simeon Cañas” (UCA). He specialized in various areas such as quantitative and qualitative research, institutional communication, popular culture, proofreading, gender, among others. In 2008, he started working in different areas, such as education, journalism, research and collaboration. Two years ago, he found out the power of data as valuable inputs to evaluate speeches and traditional perspectives on many issues, such as gender violence and memory. Currently, he work as data consultant of the Business Intelligence Department at CentralAmericaData.com, one of the main business portals in Central America, for which he elaborate economic reports.

Omar will join the Data Journalism track working with Internews and SocialTIC teams to bring data literacy to journalists in Central America

The 2016 School of Data Fellowship is possible thanks to the generous help of the following partners & funders:

Flattr this!

Why did School of Data’s fellowship adopt a thematic focus?

- February 10, 2016 in Announcement, Fellowship

The field of data literacy training is a vast one. All around the world, organisations such as School of Data are working to empower citizens and journalists to use data effectively to make change, from sanitation statistics to election data, numbers on government spending to measuring refugee figures.

Given the size of this topic, it can be hard for our fellows to choose where to focus the attention of their learning. That’s why the 2016 School of Data Fellowship is taking a thematic approach. What do we mean by this? Basically, we will be prioritising those candidates who can demonstrate experience in, and enthusiasm for, a specific area of data literacy training. We will also give preference to those individuals demonstrating links with an organisation practising in this defined area and/or links with an established network operating in the field. We hope such individuals will already have knowledge of their topic, that they will already be reflecting on the challenges they may face in their chosen area, for instance. In this way, a fellow beginning their placement has a head start; already they are well on the way to achieving the very most from their time with School of Data.

We hope that having these thematic focuses will not only focus the learning of our fellows, but allow us to support them in their work more effectively: with a clear direction in mind, we can quickly tap into our network of partner organisations and find local support for the fellows’ placement. We have come to know, through previous fellowship cycles, that fellows do best given this type of support; we want to formalise this dynamic in our 2016 round.

It’s not only a fellow that benefits from this relationship; it is through the fellow and the local, partner organisation working alongside each other that we can really magnify the impact of our work, cross-pollinating knowledge across different programmes and different countries.

Let’s take a look at each theme:

Choose your own thematic focus

  • Partner organisation: Fellows & School of Data work together
  • Positions: 4

Fellows can choose their own thematic focus during the application process. We are looking for individuals with strong experience or knowledge working with data in any number of sectors and who have identified data literacy obstacles within the field that they are are passionate about working with us to try to overcome them.

If you have expertise in anything from Election Monitoring to Disaster Risk Reduction to Fiscal Transparency or Health Service Provision, we invite you to share your experience working in the field, describe the data literacy challenges that you have identified and explain your vision for improving data literacy within the proposed thematic area.

Be creative and daring but we also encourage you to think local, we are looking for individuals who want to have a long term impact in their regions and communities.

Now, before you apply for a thematic focus of your own, take a look at the categories below. If you have experience working within one of those areas, we encourage you to apply for one of them. The advantage is that we already contacted partner organisations that are ready to support your fellowship experience, providing you with guidance, mentorship and expertise in their own domains.

Data Journalism Fellow

Partner organisation

internews


Positions: 3

There are three positions in this track. Two of them will be held by Central American candidates in El Salvador, Guatemala or Honduras. School of Data and Internews are seeking for fellows to support the launch of a regional data journalism initiative. The fellows will be contributing to three major activities: the development of a data journalism curriculum to be delivered to journalists from El Salvador, Guatemala and Honduras; working on projects with one of three digital investigative journalism outlets (El Faro in El Salvador, Plaza Publica in Guatemala and Revistazo in Honduras) and helping teams with the data component of selected cross-border reporting projects funded by Internews.

The fellows will be integral to the successful launch of this regional data journalism program and will produce much of the content that will be utilized throughout the period.

We have one more position for the Data Journalism thematic focus that is not necessarily associated with the other two. We encourage candidates from any country to suggest their own data journalism approaches to the fellowship.

Responsible Data, Privacy & Data Ethics Fellow

Partner organisation

logo


  • Position: 1

The thematic fellowship on Responsible Data can be focused on any number of issues related to responsible data. ‘Responsible data’ refers to something broader than digital or information security — it is about thinking through the duty to ensure people’s rights to consent, privacy, security and ownership of their personal information throughout all of the stages of the data life cycle.

Studying, exploring and responding to these issues is essential because the use of technology and data is increasingly prominent in contemporary social change strategies, and because the speed at which technology and data evolves means the dangers they pose are growing in unexpected and alarming ways. Because the challenges civil society faces in carrying out work are amorphous and complex, it can be next to impossible for an organization to determine how best to use data responsibly without specialist guidance.

We hope that this fellowship will provide an opportunity for a deep-dive into a specific responsible data issue (through a project lens, for example on the use of satellite footage, opened data sets, data sharing practices, data visualization, etc) in order to contribute to this developing specialised guidance.

Extractives Data Fellow

Partner organisation

nrgi


  • Position: 1

An ideal extractives data fellow would already have at least a basic understanding of the extractives sector or at least a strong desire to learn. Some familiarity with extractive contract terms and payment structures would be very useful, as well as knowledge on how to find and utilize extractives data that already exists (Open Oil Database, EITI reports, etc). A candidate with a strong desire to harness the information already available and use it to push for greater transparency and accountability, as well as knowledge sharing, would fit well with this fellowship position

Flattr this!

What was the School of Data Network up to in 2015?

- December 28, 2015 in Community, Impact

The School of Data Network is formed by member organisations, individuals, fellows and senior fellows around the world

The School of Data Network is formed by member organisations, individuals, fellows and senior fellows around the world


We just can’t believe it’s already the end of the year! I mean, every year you see people saying the months passed by so fast, but we really mean it! There was a lot going on in our community, from the second edition of our Fellowship Program to many exciting events and activities our members organised around the world.

Let’s start with folks at Code4SA. They coordinated the activities of three open data fellows and are organising the first physical Data Journalism School of the continent! Isn’t that amazing? They’re actually creating a space for people to work together with on-site support on data journalism skills. This is the first time this happens in the School of Data network and we’re really proud Code4SA is taking the lead on that! But they didn’t stop it there. They also participated in the Africa Open Data Conference, coordinated trainings and skillshares with NU & BlackSash and ran two three-day Bootcamps (Cape Town and Johannesburg). “One of our biggest challenges this year has been establishing a mandate to work with the government”, said Jennifer Walker, from Code4SA. “On the Data Journalism School, the challenge is really getting everything in place, the newsroom, the trainer etc.”

The group will pursue the project of setting up the first data-journalism agency in Macedonia (Dona Dzambaska - CC-by-sa 3.0)

In Macedonia, this group will pursue the project of setting up the first data-journalism agency in the country (Dona Dzambaska – CC-by-sa 3.0)

In Macedonia, our friends at Metamorphosis Foundation had their second School of Data Fellow, Goran Rizaov. Together with Dona Djambaska, senior School of Data Fellow (2014), they organised four open data meetups, and two 2-day open data trainings, including a data journalism workshop with local journalists in Skopje. They also launched a call for applications that resulted in Goran supporting three local NGOs in open data projects. They also supported the Institute for Rural Communities and the PIU Institute with data clinics. And if that was not enough, Dona and Goran were special guests speakers at the TEDxBASSalon.

Open Knowledge Spain and Open Knowledge Greece also were busy coordinating School of Data in their respective countries. In Spain, Escuela de Datos participated in a data journalism conference leading workshops for three days and a hackathon. They also ran monthly meeting with people interested in exploring data; they call it “open data maker nights” and also our own “data expeditions.” They will have a couple of meeting early January to set the goals for 2016. Greece organised an open science training event and also servers as the itersection between open data and linked data, coming from people working at the University of Greece.

In France, Ecole des Données has organised three activities in Paris: a local urban data laboratory, a School of Data training and the Budget Democracy Laboratory, both for the city hall. They also developed a DatavizCard Game and coordinate a working group around data visualisation. Our French friends also took part in a series of events, such as workshops, conferences, debates and MeetUps. You can check out the list here. In 2016 they want to do more collaboration with other countries and will participate in the SuperDemain (digital culture for children and families) and Futur en Seien 2016 events.

Camila Salazar & Julio Lopez, 2015 School of Data Fellows, organised a series of workshops in Latin America

Camila Salazar & Julio Lopez, 2015 School of Data Fellows, organised a series of workshops in Latin America

Across the Atlantic we arrive in the Latin American Escuela de Datos, coordinated by SocialTIC, in Mexico. Camila Salazar and Julio Lopez, two fellows from the class of 2015 did amazing things in the region, such as organasing 23 training events in four different countries (Ecuador, Costa Rica, Chile and Mexico), reaching out to more than 400 people. Julio is working with the Natural Resource Governance Institute on a major project about extractives data (stay tuned for news!) and Camila was hired by Costa Rica’s biggest data journalism team at La Nación, on top of developing a project about migrant data in the country. They’re on fire! You will hear more from them on our annual report that’s coming out early next year. “Our biggest challenge now will be having more trainers comming out of the community”, said Juan Manuel Casanueva, from SocialTIC.

Escola de Dados (Brazil) instructors and participants in a workshop about data journalism and government spending data, in São Paulo

Escola de Dados (Brazil) instructors and participants in a workshop about data journalism and government spending data, in São Paulo

Heading down to South America we see that brasileiros at Escola de Dados, in Brazil, are also on fire. They organised 22 workshops, trainings and talks/events reaching out to over 760 people in universities, companies and even government agencies. Two of their intructors were invited by the Knight Center for Journalism in the Americas to organise and run the first 100% in Portuguese MOOC about Data Journalism, with the support from the National Newspaper Association and Google. In total, 4989 people enrolled for the course which was a massive success. They also organised a data analysis course for Folha de S.Paulo, biggest broadsheet newspaper in the country. Next year is looking even better, according to Natália Mazotte, Escola de Dado’s coordinator. “We will be offering more courses with the Knight Center, will create data labs inside Rio de Janeiro favelas and will run our own fellowship program”. Outstanding!

We have so much more to share with you in our annual report that’s coming up in a few weeks. 2015 has been a great year for School of Data in many, many aspects and we are eager to share all those moments with you!

Flattr this!

Heads up for the first data journalism agency in Macedonia!

- December 3, 2015 in Event report

Developer Baze Petrushev showed participants how to use the Normal Distribution to find stories in data

Developer Baze Petrushev showed participants how to use the Normal Distribution to find stories in data (Dona Dzambaska – CC-by-sa 3.0)

Data journalism in Macedonia just got a lot stronger: a group of journalists and programmers started what could become the first data-journalism agency in the country. The group was part of the two-day workshop organised by folks at School of Data Macedonia, from member organisation Metamorphosis Foundation, as part of the ongoing support the British Embassy is providing in the region.

Journalists, programmers and data enthusiasts got together in Skopje to talk about data journalism in Macedonia (Dona Dzambaska - CC-by-sa 3.0)

Journalists, programmers and data enthusiasts got together in Skopje to talk about data journalism in Macedonia (Dona Dzambaska – CC-by-sa 3.0)


The rainy weekend (November 28th & 29th) didn’t stop 17 journalists from getting together to learn the basics of the Data Pipeline: getting, cleaning, validating, analysing and presenting data for different audiences. The workshop included groups activities and hands-on sessions with tools such as OpenRefine, for data cleaning, Google Sheets, for analysis and IFTTT for scraping. Goran Rizaov, 2015 School of Data Fellow in Macedonia was one of the trainers and organisers of the training experience. We also had the support from senior fellow (2014) Dona Dzambaska, who took amazing pictures and gave general help during the sessions.
Participants went through groups sessions and hands-on training about a variety of tools that are useful for working with data in journalism (Dona Dzambaska - CC-by-sa 3.0)

Participants went through groups sessions and hands-on training about a variety of tools that are useful for working with data in journalism (Dona Dzambaska – CC-by-sa 3.0)

Even with such a short time together, participants formed three groups and came up with prototypes of projects with great potential for the region. One of them will monitor the sporting habits of Macedonians on Twitter. “Our idea is to use hashtags and the social media API to analyse many variables, such as time of the day, the weather, which activity people are doing at the moment of the tweet, their mood, age, gender etc”, said journo-coder Bozidar Hristov, one of the members of the group.

Another group wanted to take a look at the data about the turnout in Macedonian elections, using data analysis to draw conclusions about all of the regions in the country. “We’re wondering if the turnout rate has anything to do with the geographical location”, said the developer and data-wrangler Baze Petrushev.

The group will pursue the project of setting up the first data-journalism agency in Macedonia (Dona Dzambaska - CC-by-sa 3.0)

The group will pursue the project of setting up the first data-journalism agency in Macedonia (Dona Dzambaska – CC-by-sa 3.0)

Adriana Mijuskovic and Ivana Kostovska want to start a data journalism agency in Skopje to help newsrooms publish data-driven stories. “We also want to create opportunities for journalists and programmers to work together in projects with macedonian data, also in cooperation with other networks in the Balkans”, said Adriana. The project was welcomed by the whole group and they will meet again in the coming weeks to plan next steps.

Flattr this!

Data journalism in the Philippines: changing the open data landscape in the country

- July 13, 2015 in Uncategorized

IMG_2343
Transparency, accountability and open data in the Philippines have just become more palpable to citizens and journalists alike. Open Knowledge/School of Data joined forces with the World Bank and the Philippine Center for Investigative Journalism (PCIJ) to launch a five-month training program for 34 journalists from 12 media organisations in the country. The program was kickstarted this morning in a convention in Manila, with strong support of the Philippine government.

The event gathered 87 people from all over the country and discussed the challenges and the potential collaboration efforts between civil society and the government to make the Philippines more transparent and accountable through open data. The panel was lead by Malou Mangahas, executive director of the PCIJ, who reflected on the timing and relevance of the program to the Philippines, because of the coming elections. “We’re facing big changes in leadership in the country and we need to think about the way we do conversations around public policies”, she said. “Data could be the narrative that binds us all”.

The Philippines has made remarkable efforts in recent years to open its data. In 2010 the government made a commitment to characterise itself by transparency and accountability, leading to its participation in the foundation of the Open Government Partnership in 2011 with seven other countries, including Brazil and the United States. Within the country, the most visible impact of that commitment was seen two years later with the creation of the Open Data Philippines and its Open Data Portal in the 2014. “The goal is to have more than 2000 datasets published by the end of this year”, said Usec Bon Moya, who leads the Open Data Task Force. Moya admits the number is still “a drop in the ocean of Philippine data” and welcomed the contribution of journalists and civil society activists to help the government find the data that is relevant to all stakeholders. “We need your input to make our data more consistent and publish more datasets”, he said.

One of the issues acknowledged by the panel is the hard time professionals and citizens have to understand and work with data. A lot of times stakeholders don’t have a clear grasp of how the government works. Commissioner Heidi Mendoza, from the Commission on Audit, said one way to tackle this problem is to engage citizens to work with the government in a participatory process, like the Civil Participatory Audits. “When citizens work together with auditors, they feel stimulated to get to know more the government and its programs”, she said.

“The first step to achieve transparency is to show everybody we have nothing to hide”
Keneth Abante, Department of Finance, Philippines

It goes a long way if the government itself is willing to open its data, regardless of public pressure. Kenneth Abante, from the Department of Finance knows that and showed the audience ways journalists can help the office identify frauds and get smuggles just by analysing the data they publish. “The first step to achieve transparency is to show everybody we have nothing to hide”, he said. “We release every week and month important data that can be mined by journalists and activists.” To have a taste of how to take Mr. Abante’s invitation seriously and actually find stories in data that is already published in the Philippines, Kai Kaiser, senior economist from the World Bank, walked through a mini-data investigation. Using open data about tobacco, Kaiser raised questions about components that are imported to the Philippines and the relationship between the values declared by importing companies and the actual prices in the market. “That’s how you can find holes and corruption in the system”, he said.

Kaiser’s example was picked up by Rogier van den Brink, also from the World Bank, to show how the concept of Open Government can lead to better democracies and better relationships between governments and its citizens. Nevertheless, Mr. Brink reminded the audience that transparency is not enough. “The idea of open data is potentially transformative, but more needs to be done”, he said. “We need to collect and give feedback at all times and we also need to follow up on our initiatives.”

After the conference, the 34 journalists will participate in a 3-day hands on training about data analysis, cleaning, scraping and visualisation. The workshop will be lead by our own Sam Leon, School of Data trainer and data analyst. The training is just the beginning of a 5 month process in which the journalists will have conference calls with Open Knowledge/School of Data to help on their data investigations. Ideally each group of journalists will have produced a data driven investigation by the end of the program using the skills and tools presented during the workshops and mentoring sessions. “We are very excited and looking forward to see which stories are hidden in the Philippine open data landscape”, said Sam.

Flattr this!

Brazilian journalists immerse themselves in the world of data

- May 14, 2015 in Uncategorized

A selected groups of Journalists, students of public universities and media professionals in Brazil started a no-return journey into the world of data. Escola de Dados — that’s how we call School of Data in the biggest country in Latin America — has partnered up with Universidade Federal da Bahia (UFBA), Universidade Federal do Rio de Janeiro (UFRJ), and Universidade de São Paulo (USP), three major Brazilian public universities, to offer a 30 hours, 5 days, hands-on and super intensive, Introduction to Data Journalism course.

The 100% free and on site training sessions happened in the November and December 2014 and in April 2015. They were possible thanks to the Partnership for Open Data, a program to stimulate open data initiatives in developing countries, funded by The World Bank and coordinated by Open Knowledge and Open Data Institute.

In total, 90 students, independent journalists and professionals from major media outlets from 12 different cities in Brazil were brought together by a tough selection process. More than 500 candidates from all over the country applied to Escola de Dados’ data journalism course.

16023941827_2b1302621d_z

What is this thing called data journalism?

In the first day students discussed what  data journalism is all about. From building multidisciplinary teams to borrowing skills from other areas (and discussing the business case for data journalism, of course), the lesson showcased many stories and media outlets in the world that are pushing the boundaries of journalism, investigative reporting, data analysis, data visualization and storytelling in new platforms and formats. Students reported on their core skills and their expectations for the course and formed teams to work on data stories during the week.

Here are the resources used in the first day:

Slides – Introduction to Data Journalism

Online & Offline: Where do I find (open) data? Should I clean it? How?

The second day was all about means to get data, online or offline and, once in our hands, how to clean it if needed. Students learned how to tap the powerful features of search engines to find hidden documents, narrow down searches and explore the deep web. They also talked about Brazil’s Freedom of Information Law, which allows anyone to request government data in an open format. In the last part students learned how to use Open Refine, an open source tool with wonderful tools to clean messy data.

Here are the resources used in second day:

Slides – Advanced search

Finding stories in data: asking the right questions in a different type of interview

In the third day students were invited to deepdive in the world of data analysis using a spreadsheet tool, like Open Office’s Calc or Google Sheets. The six-hour session showed the groups how stories can be dug out of datasets and what questions can be asked. Students were introduced to great functions that help journalists understand statistics and data analysis in a friendly way, like the famous “vlookup” which allows two tables with a common column to be joined for further analysis. Steve Doig, renowned data journalist and trainer from the United States, gently provided his “Datamania” table to be part of Escola de Dado’s course.

Here are the resources used in the third day:

Slides – Finding stories in data

Not magic: Scraping data from the web & data visualization

Scraping the web and ways to visualize data were the subjects of the fourth day. In the first part, students learned how to use an array of tools to scrape data from web pages, without the need to write a single line of code. They learned how a web page works inside-out using the webinspector tool present in all modern browsers and saw how tools like Google Sheets, IFTTT and Chrome’s Web Scraper extension can help journalist to extract information from web pages in an automated fashion. The second part of the class was dedicated to introduce concepts of data visualization and design. Students walked through many good and not so great examples of data visualization. They also got to know amazing free tools to visualize data, such as Infogr.am, Timeline.js, Odissey.js, Tableau Public and Datawrapper.

Here are the resources used in the fourth day:

Slides – Datavis

Slides – How web pages are structured

Slides – Webscraping

The power of Geojournalism and how maps can make you a better journalist

The last day introduced students to Geojournalism, which is basically the use of maps and geolocalised data to find relevant stories. Groups learned how to use jeo, a WordPress theme for interactive maps and journalism and cartoDB, a great tool to visualize data on maps on the web without a hassle. In the last part groups presented their data journalism projects, which included a profile of elected representatives in Rio de Janeiro, an analysis of the water shortage that affects São Paulo and a violence map of micro regions in Salvador.

We were fortunate to meet extremely talented photography and journalism students who volunteered themselves to cover the courses with blog posts and pictures throughout the two weeks in both Salvador and Rio de Janeiro. Our reporters collected testimonials from the students and wrote about the overall atmosphere of the sessions, keeping the Portuguese-speaking School of Data community up to date with our activities. We also used social media, such as twitter and Facebook to spread the word about the courses as we went. You can check out our coverage (Brazilian-Portuguese only!) in the links and photo gallery below.

Escola de Dados Blog Posts

Photo Gallery Salvador

Photo Gallery Rio de Janeiro

These courses are part of Escola de Dados broad strategy to foster data literacy in Brazil, with a focus on the journalism community. The experience showed us that there is a demand for data journalism in educational institutions in the country. Escola de Dados will keep pursuing partnerships that strengthen the connection between the academia, students and professionals so that they can build together the platform they need to prepare the next generation of journalists and of journalism itself in Brazil.

Flattr this!

Tackling PDFs with Tabula

- March 27, 2014 in Uncategorized

School of Data mentor Marco Túlio Pires has been writing for our friends at Tactical Tech about journalistic data investigation. This post introduces a tool for extracting data from PDFs, and it was originally published on Exposing the Invisible‘s resources page.

PDF files are pesky. If you copy and paste a table from a PDF into a new document, the result will be messy and ugly. You either have to type the data by hand into your spreadsheet processor or use an app to do that for you. Here we will walk through a tool that does it automatically: Tabula.

Tabula is awesome because it’s free and works on all major operating systems. All you have to do is download the zip file and extract a folder. You don’t even have to install anything, provided you’ve got Java on your machine, which is very likely. It works in your browser, and it’s all about visual controls. You use your mouse to select data you want to convert, and you download it converted to CSV. Simple as that.

Though Tabula is still experimental software, it is really easy to use. Once you fire it up, it will open your web browser with a welcome screen. Submit your PDF file and Tabula will process your file and show you a nice list of page thumbnails. Look for the table you want to extract.

Finding the table

Click and drag to select the area of the table. Once you release, Tabula will show you the extracted data in a friendly format. If the data is fuzzy, try selecting a narrower area, try removing the headers or the footnote, etc. Play around with it a bit. You can either download it as CSV and open it in a with spreadsheet program or copy the data to the clipboard.

Extracted data

Once the data is in a spreadsheet, you may need to do a bit of editing such as correcting the headers. Tabula won’t be perfect 100% of the time – it’s very good with numbers, but it can get confused by multi-line headers.

For further information and resources on Tabula, see:

Flattr this!

Learning to Listen to your Data

- March 27, 2014 in Data Stories

School of Data mentor Marco Túlio Pires has been writing for our friends at Tactical Tech about journalistic data investigation. This post “talks us through how to begin approaching and thinking about stories in data”, and it was originally published on Exposing the Invisible‘s resources page.

Journalists used to carefully establish relationships with sources in the hope of getting a scoop or obtaining a juicy secret. While we still do that, we now have a new source which we interrogate for information: data. Datasets have become much like those real sources – someone (or something!) that holds the key to many secrets. And as we begin to treat datasets as sources, as if they were someone we’d like to interview, to ask meaningful and difficult questions to, they start to reveal their stories, and more often than not, we come across tales we weren’t even looking for.

But how do we do it? How can we find stories buried underneath a pile of raw data? That’s what this post will try to show you: the process of understanding your data and listening to what your “interviewee” is trying to tell you. And instead of giving you a lecture about the ins and outs of data analysis, we’ll walk you through an example.

Let’s take an example from the The Guardian, the British newspaper that has a very active data-driven operation. We’re going to (try to) “reverse engineer” one of their stories in the hopes you get a glimpse at what happens when you go after information that you have to compile, clean, and analyse and what kind of decisions we make along the way to tell a story out of a dataset.

So, let’s talk about immigration. Every year, the Department of Immigration and Border Protection of Australia publishes a bunch of documents about immigration statistics down under. Published last year, the team at The Guardian focused on a report called Asylum Trends for 2011-2012. There’s a more up-to-date version available (2012-2013). By the end of this exercise, we hope you can use the newer version to compare it with the dataset used by The Guardian. Let us know in the comments about your findings.

The article starts with a broad question: does Australia have a problem with refugees? That’s the underlying question that helps makes this story relevant. It’s useful to start a data-driven investigation with a question, something that bothers you, something that doesn’t seem quite right, something that might be an issue for a lot of people.

With that question in mind, I quickly found a table on page 2 with the total number of people seeking protection in Australia.

People seeking Austria's protection

Let’s make a chart out of this and see what the trend is. Because this is a pesky PDF file, you’ll need to either type the data by hand into your spreadsheet processor or use an app to do that for you. For a walkthrough of a tool that does this automatically, see the Tabula example here.

After putting the PDF into Tabula this is what we get (data was imported into OpenOffice Calc):

Tabula

I opened the CSV file in OpenOffice Calc and edited it a bit to make it clearer. Let’s see how the number of people seeking Australia’s protection has changed over the years. Using the Chart feature in the spreadsheet, we can compare columns A and D by making a line chart.

Line chart

Take a good look at this chart. What’s happening here? On the vertical axis, we see the total number of people asking for Australia’s protection. On the horizontal axis, we see the timeline year by year. Between 2003 and 2008, there’s no significant change. But something happened from 2009 on. By the end of the series, it’s almost three times higher. Why? We don’t know yet. Let’s take a look at other data from the PDF and use Tabula to import it to our spreadsheet. Maybe that will show us what’s going on.

Australia divides their refugees into two groups: those who arrived by boat and those who arrived by air. They use the acronyms IMA and non-IMA (IMA stands for Irregular Maritime Arrivals). Let’s compare the totals of the two groups and see how they relate across the years presented in this report. Using Table 4 and Table 25, we’ll create a new table that has the totals for the two groups. Be careful, though, the non-IMA table goes back up to 2007, but the IMA table goes only as far as 2008. Let’s create a line chart with this data.

image 5

What’s that? It seems that in 2011-2012, for the first time in this time series, the number of refugees arriving in Australia by boat surpassed those landing by plane. The next question could be: where are all the IMA refugees coming from? We already have the data from table 25. Let’s make a chart out of that, considering the period 2011-2012. That would be columns A and E of our data. Here’s a donut chart with the information:

Donut chart

Afghanistan (deep blue) and Iran (orange) alone represent more than 64% of all IMA refugees in Australia in 2011-2012.

From here, there are a lot of routes we could take. We could use the report to take a look at the age of the refugees, like the folks at The Guardian did. We could compare IMA and non-IMA countries and see if there’s a stark difference and, if so, ask why that’s the case. We could look at why Afghans and Iranians are travelling by boat and not plane, and what risks they face as a result. How does the data in this report compare with the data from the more recent report? The analysis could be used to come up with a series of questions to ask to the Australian government or a specialist on immigration.

Whatever the case might be, it’s worth remembering that finding stories in data should never be an activity that ends in itself. We’re talking about data that’s built on the behavior of people, on the real world. The data is always connected to something out there, you just need to listen to what your spreadsheet is saying. What do you say? Got data?

Flattr this!