You are browsing the archive for Noah Veltman.

Scraping the web

- November 25, 2013 in HowTo

Dried paint samples and scraping tools

Photo credit: Sharilyn Neidhart

School of Data is re-publishing Noah Veltman‘s Learning Lunches, a series of tutorials that demystify technical subjects relevant to the data journalism newsroom.

This Learning Lunch is about web scraping: automatically extracting data from web pages.

Web scraping refers to the practice of writing code that will load a web page in order to extract some information from it automatically. It’s like a Roomba for the web.

Let’s say you wanted to save information about every US federal law with a certain keyword in it. You might have to get it directly from search results in THOMAS. If there are three results, you could just manually copy and paste the information into a spreadsheet. If there are three thousand results, you probably don’t want to do that. Enter the scraper. If you specify exactly what a law looks like in a page of search results, you can then tell the scraper to save every one it finds into a text file or a database or something like that. You also teach it how to advance to the next page, so that even though only ten results are displayed per page, it can cycle through all of them.

When is a scraper useful?

Information you can scrape is virtually always information you can get by hand if you want. It’s the same data that gets returned when a human being loads the page. The reason to create a web scraper is to save yourself time, or create an autopilot that can keep scraping while you’re not around. If you need to get a lot of data, get data at an automatic interval, or get data at specific arbitrary times, you want to write code that uses an API or a scraper. An API is usually preferable if it supplies the data you want; a scraper is the fallback option for when an API isn’t available or when it doesn’t supply the data you want. An API is a key; a scraper is a crowbar.

See also: Web APIs

What’s hard to scrape?

The best way to understand how a scraper thinks might be to think about what kinds of data are hard to scrape.

Inconsistent data

When it comes to writing a scraper, the name of the game is consistency. You’re going to be writing a code that tells the scraper to find a particular kind of information over and over. The first step is detective work. You look at an example page you want to scrape, and probably view the page source, and try to figure out the pattern that describes all of the bits of content you want and nothing else. You don’t want false positives, where your scraper sees junk and thinks it’s what you wanted because your instructions were too broad; you also don’t want false negatives, where your scraper skips data you wanted because your instructions were too narrow. Figuring out that sweet spot is the essence of scraping.

Consider trying to scrape all of the headlines from the New York Times desktop site, excluding video and opinion content. The headlines aren’t displayed in the most consistent way, which may make for a better reading experience, but makes it harder to deduce the perfect pattern for scraping:

New York Times - desktop

On the other hand, if you looked at the New York Times mobile site, you’d have a comparatively easier time of the same task, because the headlines are displayed with rigid consistency:

New York Times - mobile

Generally speaking, there are two big tools in the scraper toolbox for how you give a scraper its instructions:

The DOM

A web page is generally made up of nested HTML tags. Think of a family tree, or a phylogenetic tree. We call this tree the DOM.

For example, a table is an element with rows inside of it, and those rows are elements with cells inside of them, and then those cells are elements with text inside them. You might have a table of countries and populations, like this.

<table> The whole table
    <tr>
        <td>COUNTRY NAME</td>
        <td>POPULATION</td>
    </tr>        
    <tr>
        <td>United States</td>
        <td>313 million</td>
    </tr>        
    <tr>
        <td>Canada</td>
        <td>34 million</td>
    </tr>        
</table>

You will often have the scraper “traverse” this in some fashion. Let’s say you want all the country names in this table. You might tell the scraper, “find the table, and get the data from the first cell in each row.” Easy enough, right? But wait. What about the header row? You don’t want to save “COUNTRY NAME” as a country, right? And what if there is more than one table on the page? Just because you only see one table doesn’t mean there aren’t others. The menu buttons at the top of the page might be a table. You need to get more specific, like “find the table that has ‘COUNTRY NAME’ in the first cell, and get the data from the first cell in each row besides the first.”

You can give a scraper instructions in terms of particular tags, like:

  • Find all the <td> tags
  • Find the second <img> tag
  • Find every <a> tag that’s inside the third <table> tag

You can also use tag properties, like their IDs and classes, to search more effectively (e.g. “Find every <a> tag with the class external” would match a tag like <a href="http://google.com/" class="external">“).

Regular expressions

Regular expressions are the expert level version of scraping. They are for when the data you want is not neatly contained in a DOM element, and you need to pull out text that matches a specific arbitrary pattern instead. A regular expression is a way of defining that pattern.

Let’s imagine that you had a news article and you wanted to scrape the names of all the people mentioned in the article. Remember, if you were doing this for one article, you could just do it by hand, but if you can figure out how to do it for one article you can do it for a few thousand. Give a scraper a fish…

You could use a regular expression like this and look for matches:

/[A-Z][a-z]+\s[A-Z][a-z]+/

(If you are noticing the way this expression isn’t optimized, stop reading, this primer isn’t for you.)

This pattern looks for matches that have a capital letter followed by some lowercase letters, then a space, then another capital letter followed by lowercase letters. In short, a first and last name. You could point a scraper at a web page with just this regular expression and pull all the names out. Sounds great, right? But wait.

Here are just a few of the false positives you would get, phrases that are not a person’s name but would match this pattern anyway:

  • Corpus Christi
  • Lockheed Martin
  • Christmas Eve
  • South Dakota

It would also match a case where a single capitalized word was the second word in a sentence, like “The Giants win the pennant!”

Here are just a few of the false negatives you would get, names that would not match this pattern:

  • Sammy Davis, Jr.
  • Henry Wadsworth Longfellow
  • Jean-Claude Van Damme
  • Ian McKellen
  • Bono
  • The Artist Formerly Known as Prince

The point here is that figuring out the right instructions for a scraper can be more complicated than it seems at first glance. A scraper is diligent but incredibly stupid, and it will follow all of your instructions to the letter, for better or worse. Most of the work of web scraping consists of the detective work and testing to get these patterns right.

The simpler and more consistent your information is, the easier it will be to scrape. If it appears exactly the same way in every instance, with no variation, it’s scraper-friendly. If you are pulling things out of a simple list, that’s easier than cherry-picking them from a rich visual layout. If you want something like a ZIP code, which is always going be a five-digit number (let’s ignore ZIP+4 for this example), you’re in pretty good shape. If you want something like an address, that mostly sticks to a pattern but can have thousands of tiny variations, you’re screwed.

Exceptions to the rule are a scraper’s nemesis, especially if the variations are minor. If the variations are large you’ll probably notice them, but if they’re tiny you might not. One of the dangers in creating a scraper to turn loose on lots of pages is that you end up looking at a sample of the data and making the rules based on that. You can never be sure that the rest of the data will stick to your assumptions. You might look at the first three pages only to have your data screwed up by an aberration on page 58. As with all data practices, constant testing and spot checking is a must.

AJAX and dynamic data

A basic scraper loads the page like a human being would, but it’s not equipped to interact with the page. If you’ve got a page that loads data in via AJAX, has time delays, or changes what’s on the page using JavaScript based on what you click on and type, that’s harder to scrape. You want the data you’re scraping to all be in the page source code when it’s first loaded.

Data that requires a login

Mimicking a logged in person is more difficult than scraping something public. You need to create a fake cookie, essentially letting the scraper borrow your ID, and some services are pretty sophisticated at detecting these attempts (which is a good thing, because the same method could be used by bad guys).

Data that requires the scraper to explore first

If you want to pull data off a single page, and you know the URL, that’s pretty straightforward. Feed the scraper that URL and off it goes. Much more common, though, is that you are trying to scrape a lot of pages, and you don’t know all the URLs. In that case the scraper needs to pull double duty: it must scout out pages by following links, and it must scrape the data off the results. The easy version is when you have a hundred pages of results and you need to teach your scraper to follow the “Next Page” link and start over. The hard version is when you have to navigate a complex site to find data that’s scattered in different nooks and crannies. In addition to making sure you scrape the right data off the page, you need to make sure you’re on the right page in the first place!

Example 1: THOMAS

Let’s imagine you wanted to scrape the bill number, title, and sponsor of every law passed by the 112th session of the United States Congress. You could visit THOMAS, the official site for Congressional legislative records. It turns out they keep a handy list of Public Laws by session, so that saves you some time. When you click on the 112th Congress, you’ll notice there are links to two pages of results, so you’ll need to scrape both of those URLs and combine the results:

THOMAS #1

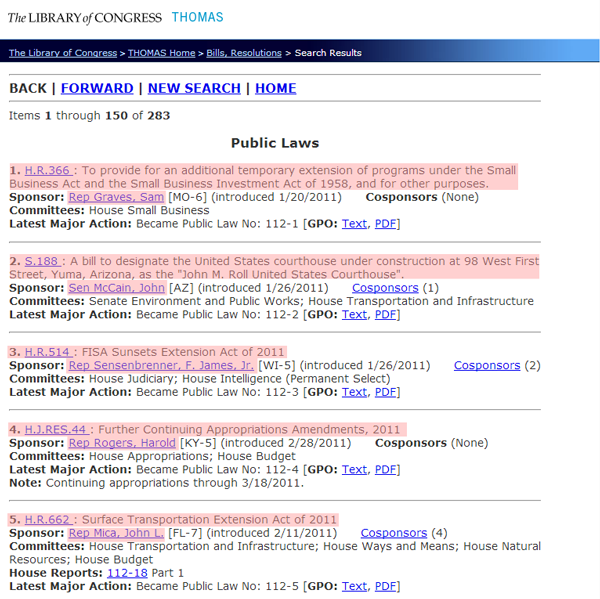
On each page, you get a list of results that displayed the name and sponsor of the law in a seemingly consistent way:
THOMAS #1

In order to scrape that information and nothing else, we need to put our source code detective hats on (if you’re going to start scraping the web, make sure you get a proper source code detective hat and a film noir detective’s office). This is where it gets messy. That list looks like this.

<p>
<hr/><font size="3"><strong>
BACK | <a href="/cgi-bin/bdquery/L?d112:./list/bd/d112pl.lst:151[1-283](Public_Laws)[[o]]|TOM:/bss/d112query.html|">FORWARD</a> | <a href="/bss/d112query.html">NEW SEARCH</a>
 | <a href="/home/thomas.html">HOME</a>
</strong></font><hr/>
Items <b>1</b> through <b>150</b> of <b>283</b>
<center><h3>Public Laws</h3></center><p><b>  1.</b> <a href="/cgi-bin/bdquery/z?d112:HR00366:|TOM:/bss/d112query.html|">H.R.366 </a>:  To provide for an additional temporary extension of programs under the Small Business Act and the Small Business Investment Act of 1958, and for other purposes.<br /><b>Sponsor:</b> <a href="/cgi-bin/bdquery/?&amp;Db=d112&amp;querybd=@FIELD(FLD003+@4((@1(Rep+Graves++Sam))+01656))">Rep Graves, Sam</a> [MO-6]
(introduced 1/20/2011) &nbsp;&nbsp;&nbsp;&nbsp;&nbsp;<b>Cosponsors</b> (None)
<br /><b>Committees: </b>House Small Business
<br /><b>Latest Major Action:</b>  Became Public Law No: 112-1 [<b>GPO:</b> <a href="/cgi-bin/toGPObsspubliclaws/http://www.gpo.gov/fdsys/pkg/PLAW-112publ1/html/PLAW-112publ1.htm">Text</a>, <a href="/cgi-bin/toGPObsspubliclaws/http://www.gpo.gov/fdsys/pkg/PLAW-112publ1/pdf/PLAW-112publ1.pdf">PDF</a>]<hr/>
<p><b>  2.</b> <a href="/cgi-bin/bdquery/z?d112:SN00188:|TOM:/bss/d112query.html|">S.188 </a>:  A bill to designate the United States courthouse under construction at 98 West First Street, Yuma, Arizona, as the "John M. Roll United States Courthouse".<br /><b>Sponsor:</b> <a href="/cgi-bin/bdquery/?&amp;Db=d112&amp;querybd=@FIELD(FLD003+@4((@1(Sen+McCain++John))+00754))">Sen McCain, John</a> [AZ]
(introduced 1/26/2011) &nbsp;&nbsp;&nbsp;&nbsp;&nbsp;<a href='/cgi-bin/bdquery/z?d112:SN00188:@@@P'>Cosponsors</a> (1)
<br /><b>Committees: </b>Senate Environment and Public Works; House Transportation and Infrastructure
<br /><b>Latest Major Action:</b>  Became Public Law No: 112-2 [<b>GPO:</b> <a href="/cgi-bin/toGPObsspubliclaws/http://www.gpo.gov/fdsys/pkg/PLAW-112publ2/html/PLAW-112publ2.htm">Text</a>, <a href="/cgi-bin/toGPObsspubliclaws/http://www.gpo.gov/fdsys/pkg/PLAW-112publ2/pdf/PLAW-112publ2.pdf">PDF</a>]<hr/>
<p><b>  3.</b> <a href="/cgi-bin/bdquery/z?d112:HR00514:|TOM:/bss/d112query.html|">H.R.514 </a>:  FISA Sunsets Extension Act of 2011<br /><b>Sponsor:</b> <a href="/cgi-bin/bdquery/?&amp;Db=d112&amp;querybd=@FIELD(FLD003+@4((@1(Rep+Sensenbrenner++F.+James++Jr.))+01041))">Rep Sensenbrenner, F. James, Jr.</a> [WI-5]
(introduced 1/26/2011) &nbsp;&nbsp;&nbsp;&nbsp;&nbsp;<a href='/cgi-bin/bdquery/z?d112:HR00514:@@@P'>Cosponsors</a> (2)
<br /><b>Committees: </b>House Judiciary; House Intelligence (Permanent Select)
<br /><b>Latest Major Action:</b>  Became Public Law No: 112-3 [<b>GPO:</b> <a href="/cgi-bin/toGPObsspubliclaws/http://www.gpo.gov/fdsys/pkg/PLAW-112publ3/html/PLAW-112publ3.htm">Text</a>, <a href="/cgi-bin/toGPObsspubliclaws/http://www.gpo.gov/fdsys/pkg/PLAW-112publ3/pdf/PLAW-112publ3.pdf">PDF</a>]<hr/>
<p><b>  4.</b> <a href="/cgi-bin/bdquery/z?d112:HJ00044:|TOM:/bss/d112query.html|">H.J.RES.44 </a>:  Further Continuing Appropriations Amendments, 2011<br /><b>Sponsor:</b> <a href="/cgi-bin/bdquery/?&amp;Db=d112&amp;querybd=@FIELD(FLD003+@4((@1(Rep+Rogers++Harold))+00977))">Rep Rogers, Harold</a> [KY-5]
(introduced 2/28/2011) &nbsp;&nbsp;&nbsp;&nbsp;&nbsp;<b>Cosponsors</b> (None)
<br /><b>Committees: </b>House Appropriations; House Budget
<br /><b>Latest Major Action:</b>  Became Public Law No: 112-4 [<b>GPO:</b> <a href="/cgi-bin/toGPObsspubliclaws/http://www.gpo.gov/fdsys/pkg/PLAW-112publ4/html/PLAW-112publ4.htm">Text</a>, <a href="/cgi-bin/toGPObsspubliclaws/http://www.gpo.gov/fdsys/pkg/PLAW-112publ4/pdf/PLAW-112publ4.pdf">PDF</a>]<br /><b>Note: </b>Continuing appropriations through 3/18/2011.
<hr/>
<p><b>  5.</b> <a href="/cgi-bin/bdquery/z?d112:HR00662:|TOM:/bss/d112query.html|">H.R.662 </a>:  Surface Transportation Extension Act of 2011<br /><b>Sponsor:</b> <a href="/cgi-bin/bdquery/?&amp;Db=d112&amp;querybd=@FIELD(FLD003+@4((@1(Rep+Mica++John+L.))+00800))">Rep Mica, John L.</a> [FL-7]
(introduced 2/11/2011) &nbsp;&nbsp;&nbsp;&nbsp;&nbsp;<a href='/cgi-bin/bdquery/z?d112:HR00662:@@@P'>Cosponsors</a> (4)
<br /><b>Committees: </b>House Transportation and Infrastructure; House Ways and Means; House Natural Resources; House Budget

<br/><b>  House Reports: </b>
<a href="/cgi-bin/cpquery/R?cp112:FLD010:@1(hr018)">112-18</a> Part 1<br /><b>Latest Major Action:</b>  Became Public Law No: 112-5 [<b>GPO:</b> <a href="/cgi-bin/toGPObsspubliclaws/http://www.gpo.gov/fdsys/pkg/PLAW-112publ5/html/PLAW-112publ5.htm">Text</a>, <a href="/cgi-bin/toGPObsspubliclaws/http://www.gpo.gov/fdsys/pkg/PLAW-112publ5/pdf/PLAW-112publ5.pdf">PDF</a>]<hr/>

What? OK, calm down. There’s a lot going on in there, but we can compare what we see visually on the page with what we see in here and figure out the pattern. You can isolate a single law and see that it follows this pattern:

<p><b>  1.</b> <a href="/cgi-bin/bdquery/z?d112:HR00366:|TOM:/bss/d112query.html|">H.R.366 </a>:  To provide for an additional temporary extension of programs under the Small Business Act and the Small Business Investment Act of 1958, and for other purposes.<br /><b>Sponsor:</b> <a href="/cgi-bin/bdquery/?&amp;Db=d112&amp;querybd=@FIELD(FLD003+@4((@1(Rep+Graves++Sam))+01656))">Rep Graves, Sam</a> [MO-6]
    (introduced 1/20/2011) &nbsp;&nbsp;&nbsp;&nbsp;&nbsp;<b>Cosponsors</b> (None)
    <br /><b>Committees: </b>House Small Business
    <br /><b>Latest Major Action:</b>  Became Public Law No: 112-1 [<b>GPO:</b> <a href="/cgi-bin/toGPObsspubliclaws/http://www.gpo.gov/fdsys/pkg/PLAW-112publ1/html/PLAW-112publ1.htm">Text</a>, <a href="/cgi-bin/toGPObsspubliclaws/http://www.gpo.gov/fdsys/pkg/PLAW-112publ1/pdf/PLAW-112publ1.pdf">PDF</a>]<hr/>

The bill number is located inside a link:

<a href="...">H.R.366 </a>

But we can’t treat every link as a bill number, there are other links too. This link comes after two <b> tags, so maybe we can use that, but that would also match some other links, like:

<b>GPO:</b> <a href="...">Text</a>

So we need to get more specific. We could, for example, specify that we want each link that comes after a numeral and a period between two <b> tags:

<b>  1.</b><a href="...">H.R.366 </a>

There’s more than one way to skin this particular cat, which is nothing unusual when it comes to scraping.

We can get the sponsor’s name by looking for every link that comes immediately after <b>Sponsor:</b> and getting the text of that link.

<b>Sponsor:</b> <a href="/cgi-bin/bdquery/?&amp;Db=d112&amp;querybd=@FIELD(FLD003+@4((@1(Rep+Graves++Sam))+01656))">Rep Graves, Sam</a>

leads us to

<a href="/cgi-bin/bdquery/?&amp;Db=d112&amp;querybd=@FIELD(FLD003+@4((@1(Rep+Graves++Sam))+01656))">Rep Graves, Sam</a>

which leads us to

Rep Graves, Sam

We need to consider special cases. Can a bill have more than one sponsor? Can it have no sponsors? We also need to make sure we parse that name properly. Does every sponsor start with “Rep”? No, some of them are senators and start with “Sen”. Are there any other weird abbreviations? Maybe non-voting delegates from Guam can still sponsor bills and are listed as “Del”, or something like that. We want to spot check as much of the list as possible to test this assumption. We also want to investigate whether a sponsor’s name could have commas in it before we assume we can split it into first and last name by splitting it at the comma. If we scroll down just a little bit on that first page of results, we’ll find the dreaded exception to the rule:

Sen Rockefeller, John D., IV

Now we know that if we split on the first comma, we’d save his name as “John D., IV Rockefeller,” and if we split on the last comma, we’d save his name as “IV Rockefeller, John D.” Instead we need something more complicated like: split the name by all the commas. The first section is the last name, the second section is the first name, and if there are more than two sections, those are added to the end, so we get the correct “John D. Rockefeller IV.”

Example 2: sports teams, stadiums, and colors

Let’s say you wanted to get the list of all NFL football teams with their stadiums, stadium locations, and team colors. Wikipedia has most of this information available in some form or another. You could start here and you’d find this table:
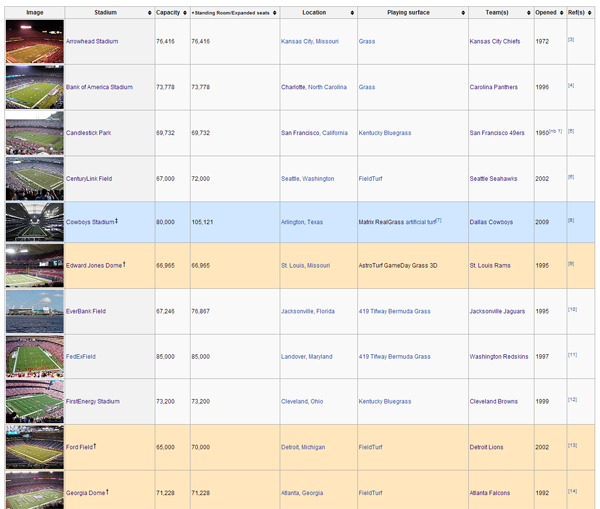
NFL #1

This seems pretty straightforward. The second column is the stadium name, the fifth column is the location, and the seventh column is the team, so that gets us 3 out of the 4 data points we want.

But of course it’s not that simple. Wikipedia sometimes includes annotations in the text, and we want to make sure we don’t include those as part of what we scrape. Then, if you scroll down to MetLife Stadium, you find the dreaded exception to the rule. It has two teams, the Giants and Jets. We need to save this row twice, once for each team.

Let’s imagine we wanted a more specific location than the city. We could do this by having our scraper follow the link in the “Stadium” column for each row. On each stadium’s page, we’d find something like this:

NFL #2

We could save that and we’d have a precise latitude/longitude for each stadium.

In the same fashion, we can get the team colors by following the link to each team in the “Team(s)” column. We’d find something like this:
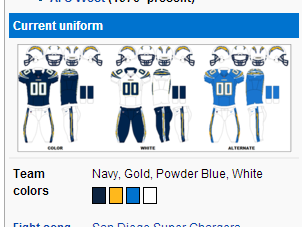
NFL #3

If we inspect those elements, we’d find something like this:
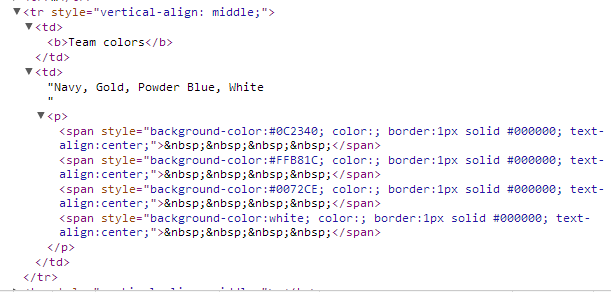
NFL #4

That “background-color” is what we want, and there’s one for each color swatch on the page. So we could say something like “Find the table cell that says ‘Team colors’ inside it, then go to the next cell and get the background color of every <span> inside a pair of <p> tags.”

You’ll notice that three of them are special color codes (“#0C2340″,”#FFB81C”,”#0072CE”) and one is plain English (“white”), so we need to keep that in mind, possibly converting “white” into a special color code so they all match. As usual, we need to be skeptical of the assumption that every page will follow the same format as this one. If you look at the San Francisco 49ers page, you’ll see that the way the colors are displayed varies slightly:
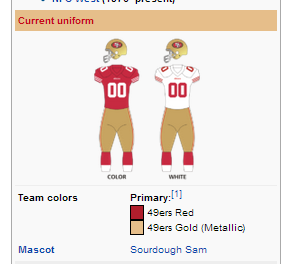
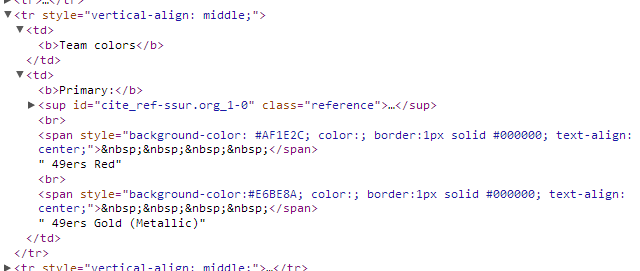
NFL #5

NFL #6

The rule we wrote before turns out to be overly specific. These <span> tags aren’t inside of <p> tags. Instead, we need to broaden our rule to get the background-color of any <span> in that cell.

ScraperWiki: Your web scraping sandbox

If you want to write your own scrapers, there’s no way around writing some code. A scraper is nothing but code. If you’re a beginner, though, you can check out ScraperWiki, a tool for writing simple web scrapers without a lot of the hassle of setting up your own server. The best thing about ScraperWiki is that you can browse existing scrapers other people have written, which will help you learn how scraper code works, but also give you the opportunity to clone and modify an existing scraper for a new purpose instead of writing one from scratch. For instance, this is a basic Twitter search scraper:

https://scraperwiki.com/scrapers/ddj_twitter_scraper_9/

By just changing the value of QUERY, you have your own custom Twitter scraper that will save tweets that match that search and give you a table view of them.

This scraper saves Globe and Mail headlines:

https://scraperwiki.com/scrapers/bbc_headlines_8/

If you add an extra line to filter them, you can start saving all Globe and Mail headlines that match a particular keyword.

Flattr this!

XML and JSON: the tale of the tape

- November 21, 2013 in HowTo

Unidentified African-American boxer

Photo credit: Boston Public Library

School of Data is re-publishing Noah Veltman‘s Learning Lunches, a series of tutorials that demystify technical subjects relevant to the data journalism newsroom.

This Learning Lunch is about XML and JSON, two popular machine-readable data formats that are commonly used by web APIs, described in the previous Learning Lunch.

Almost every popular web API returns data in one of two formats: XML or JSON. These formats can be very confusing. They look very different from how you are probably used to thinking of data. XML and JSON are not like a spreadsheet. They are both very flexible specifications for representing almost any kind of data. Both involve nesting, so you can represent complex data with lots of levels.

For example, you can have a list of countries, and each country can have a list of cities, and and each city can have a list of neighborhoods. Or think of a family tree, which can be represented easily enough in XML or JSON. You want to track some information about each person (e.g. their date of birth), but also their relationship to everything else. Every time you try to express complex nested relationships like these in a single two-dimensional table, an angel loses its wings.

A note on whitespace: In my examples, I indent things and put them on separate lines in order to make it clear what is inside what, but this is just for clarity. You can get rid of all this whitespace and put everything on one long line and it won’t change anything. Often, when you encounter data in the wild, like via an API, everything will be compressed onto one line with no whitespace. This is efficient but makes it harder to read. You can always dump it into a tool that will make it more readable, like this one.

The basics: XML

If you’ve ever worked with HTML, you understand the general idea behind XML too. Elements are defined by tags. Each element has a name and consists of an opening tag and a closing tag (these are expressed as <tagname> and </tagname>, respectively). Anything in between those two tags belongs to that element. It is the “parent” element of whatever is between the opening and closing tags. Those things in between are its “children.” Anything that is next to it, neither its parent nor its child, is its “sibling.”

<country>
    <city>
        <neighborhood>
        </neighborhood>
        <neighborhood>
        </neighborhood>            
    </city>
    <city>
        <neighborhood>
        </neighborhood>
    </city>        
</country>

In this example, you have a country with two cities in it. The first city has two neighborhoods in it, the second city only has one. So far this isn’t very helpful, because we haven’t specified WHICH country and cities we’re talking about. We can do that by adding attributes, which go inside the opening tag:

<country name="United States" population="311591917">
    <city name="New York" population="8336697">
        <neighborhood name="East Village">
        </neighborhood>
        <neighborhood name="Harlem">
        </neighborhood>            
    </city>
    <city name="Los Angeles" name="3819702">
        <neighborhood name="Hollywood">
        </neighborhood>
    </city>        
</country>

Now each element has attributes. We know the population of the country, the population of the cities, and the names of everything. We could add as many attributes as we want. The tag name tells you what type of thing an element is, and the attributes tell you details about it.

When you have a list of similar things in XML, you’ll typically see a list of siblings like those two cities, one after the next.

<country>       
    <city></city>
    <city></city>
    <city></city>
    <city></city>
    <city></city>
</country>

Sometimes you’ll see a list like that enclosed in some sort of container element, like this:

<country>
    <cities>
        <city></city>
        <city></city>
        <city></city>
        <city></city>
        <city></city>
    </cities>
</country>

But it’s not required. When you have individual bits of data about an element (text, numbers, a date, that sort of thing), you can put it in attributes, but you can also make it the content of a tag. These are largely equivalent:

<city name="Los Angeles"></city>

<city>
    <name>Los Angeles</name>
</city>

Reasons vary as to why someone might want to do it one way vs. the other when creating XML. If you use an attribute, you’re not supposed to have a second attribute of the same name. The value of an attribute is only supposed to be simple text and numbers, so you can’t nest things inside of it. While both examples above work for expressing that the city has the name “Los Angeles”, if you had a city inside a country, or a city with multiple name variations, that would be a problem:

This is OK:
<country>
    <city name="Los Angeles"></city>
</country>

This is NOT OK:
<country city="<city name="Los Angeles"></city>">    
</country>

This is OK:
<city>
    <name>Los Angeles</name>
    <name>LA</name>
</city>

This is NOT OK:
<city name="Los Angeles" name="LA">
</name>

A note on self-closing tags: You will also sometimes see an opening tag with no matching closing tag and a slash at the end instead, like this:

<city name="Los Angeles" />

This is just a shorthand way of declaring an element with nothing else inside.

These are equivalent:

<city name="Los Angeles"></city>

<city name="Los Angeles" />

To sum up, when looking at an XML document, you need to understand:

  • An XML file is a hierarchy of elements.
  • Elements are made up of an opening and closing tag and whatever is in between. In between it can have simple text and numbers, other elements, or both (or nothing).
  • The opening tag of an element can also have attributes in the format name="value". Each value should be simple text and numbers, not other elements.

A note on data types: a common question for people trying to learn about XML and JSON is how to store some special type of data, like a date or a time. XML and JSON don’t generally have a special way of dealing with things like this. You store them as text or numbers just like anything else, hopefully using some consistent format, like “10/18/2012” or “October 8, 2012” and then deal with parsing that later as needed.

The basics: JSON

JSON is a little trickier than XML unless you have some experience with JavaScript. JSON is a format largely made up of arrays and objects. When something is surrounded by [] square brackets, it’s an array. When something is surrounded by {} curly braces, it’s an object.

Arrays

An array is a list of items in order, separated by commas, like this:

["New York","Los Angeles","Chicago","Miami"]    

New York is first, Miami is last. It’s OK if you don’t care about the order, just remember that it exists. Items in an array can be a bit of data (like text or a number), but they can also be objects or other arrays.

[["New York","Los Angeles","Chicago"],["Florence","Venice","Rome"]]

That list that is two items long. The first item is another list, of three US cities. The second item is also a list, of three Italian cities.

[{"name":"New York"},{"name":"Los Angeles"},{"name":"Chicago"}]

Don’t worry about the details of that list just yet, but just notice that it’s a list of three items, and each item is an object.

An array is a list, but it can have only one item, or zero items. These are both perfectly valid arrays:

[]

["Just one item"]

Objects

Objects also look like lists of things, but you shouldn’t think of them as lists. Each item is called a property and it has both a name and a value. The name is always enclosed in double quotes. Each one should only occur once in an object. They’re similar to attributes in an XML opening tag.

This is OK:
{
    "name": "Los Angeles",
    "population": 3819702
}

This is NOT OK:
{
    "name": "Los Angeles",
    "name": "LA",
    "population": 3819702
}

Like an array, the value can be simple text or numbers, but it can also be an array or another object. So to fix the above example, you could do this:

{
    "names": ["Los Angeles","LA"],
    "population": 3819702
}

Two more examples:

{
    "name": "United States",
    "cities": ["New York","Los Angeles","Chicago"]
}

{
    "name": "United States",
    "leaders": {
        "president": "Barack Obama",
        "vicePresident": "Joe Biden"
    }
}

Note on property names: you can use spaces in your property names if you really want to, like “vice president”, but you should avoid it. “vicePresident” or “vice_president” would be better, because if the data is going to end up used in code later, the spaces can be problematic.

An array is used for expressing a flat list of things (like sibling elements in XML), and an object is used for expressing specific details about one thing (like element attributes in XML).

I could, for example, use an object to list cities, but because each property requires a name, I’d have to specify an arbitrary unique name for each entry:

{
    "city1": "Los Angeles",
    "city2": "New York",
    "city3": "Chicago"
}

In the interest of flexibility, I would rather use an array. That way, I can more easily add and subtract items. It’s also easier to use code later to find out how many cities are in the list or do something to them in order.

{
    "cities": ["New York","Los Angeles","Chicago"]   
}

The opposite is also true. I could use an array for a list of properties:

["Los Angeles","California",3819702]

I can use that as long as I remember that the first item in the list is the name of the city, the second item is the state it’s in, and the third item is the city’s population. But why bother? Using an object is better, because these are unique properties about the city. An object is more descriptive. If I need to add or remove properties, it’s much easier:

{  
    "name": "Los Angeles",
    "state": "California",
    "population": 3819702
}

Once you grasp those twin concepts, JSON will make a lot more sense.

  • Arrays are for flat lists of things. They have a size and a sequence. If you can have more than one instance of a thing, you want an array.
  • Objects are for unique descriptive details about something; the properties are written out like a list, but don’t think of them as a list. Think of an object like a profile.

JSON is made up entirely of those two kinds of nesting: objects and arrays. Each object can have other objects or arrays as values. Each array can have other arrays or objects as items in the list.

[
  {
    "name": "United States",
    "population": 311591917,
    "cities": [
      {
        "name": "New York",
        "population": 8336697
      },
      {
        "name": "Los Angeles",
        "population": 3819702
      }
    ]
  },
  {
    "name": "Italy",
    "population": 60626442,
    "cities": [
      {
        "name": "Rome",
        "population": 2777979
      },
      {
        "name": "Florence",
        "population": 357318
      }
    ]
  },   
]

This is an array, a list with two objects in it. Both objects represent countries. They have properties for the country name and population. Then they have a third property, “cities”, and its value is an array. That array contains two MORE objects, each representing a city with a name and population. It seems confusing, but it’s a pretty flexible, logical way to store this information once you wrap your head around it.

To sum up, when looking at JSON, you need to understand:

  • An array is a flat list of values. Those values can be simple data, or they can be arrays or objects themselves.
  • An object is a set of named properties describing something. Each one has a value, and that value can be simple data or it can be an array or an object itself.

Things to think about

If you have a choice between getting data as XML or JSON, get whichever you’re more comfortable with, unless the data is going to be plugged directly into a web application. If someone is going to power JavaScript with the data, you want JSON, which is very JavaScript-friendly.

Also keep in mind that there are often multiple perfectly reasonable ways to structure the same data. Whoever came up with the structure for the data you’re getting may have had any number of reasons for doing it the way they did. Just concentrate on understanding the structure of the data you’re looking at before doing anything else with it.

Example: The Thrilla in Manila

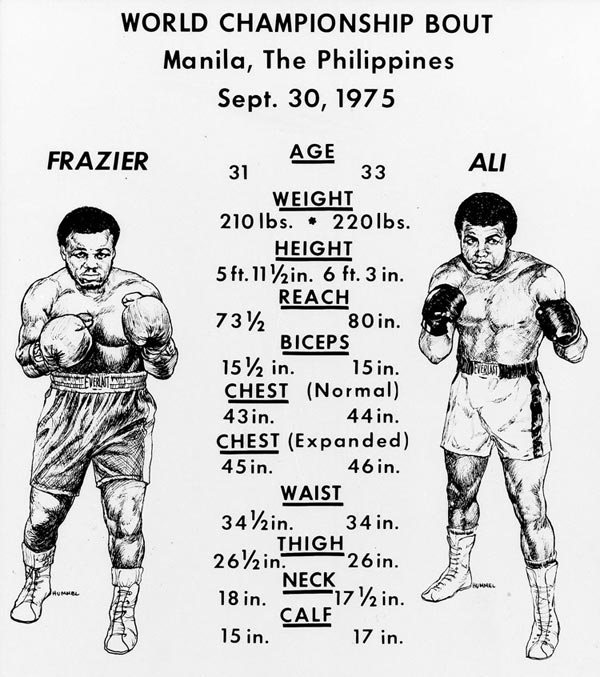
Boxing matches traditionally have something called “the tale of the tape,” which compares the physical characteristics of the two fighters. This is the tale of the tape for the 1975 Thrilla in Manila between Muhammad Ali and Joe Frazier:

The Thrilla in Manila

Let’s look at how you might express a fighter’s characteristics in XML:

<fighter name="Joe Frazier">
    <age>31</age>
    <weight>210</weight>
    <height>71.5</height>
    <reach>73.5</reach>        
    <biceps>15.5</biceps>
    <chest>
        <normal>43</normal>
        <expanded>45</expanded>
    </chest>    
    <waist>34.5</waist>
    <thigh>26.5</thigh>
    <neck>18</neck>
    <calf>15</calf>
</fighter>

You might want to specify units to be more helpful:

<fighter name="Joe Frazier">
    <age>31</age>
    <weight unit="pounds">210</weight>
    <measurements unit="inches">
        <height>71.5</height>
        <reach>73.5</reach>        
        <biceps>15.5</biceps>
        <chest>
            <normal>43</normal>
            <expanded>45</expanded>
        </chest>    
        <waist>34.5</waist>
        <thigh>26.5</thigh>
        <neck>18</neck>
        <calf>15</calf>
    </measurements>
</fighter>

You could also put all the data into the <fighter> tag as attributes instead, as long as you collapse the two chest measurements:

<fighter name="Joe Frazier" age="31" weight="210" height="71.5" reach="73.5" biceps="15.5" chest-normal="43" chest-expanded="45" waist="34.5" thigh="26.5" neck="18" calf="15" />

In JSON, it might look like this:

{
  "name": "Joe Frazier",
  "age": 31,
  "measurements": {
    "weight": 210,
    "height": 71.5,
    "reach": 73.5,
    "biceps": 15.5,
    "chest": {
      "normal": 43,
      "expanded": 45
    },
    "waist": 34.5,
    "thigh": 26.5,
    "neck": 18,
    "calf": 15
  }
}

Now let’s imagine you want to express both fighters, along with some info about the fight itself:

<fight location="Manila, The Philippines" date="September 30, 1975">    
    <fighter name="Joe Frazier">
        <age>31</age>
        <weight unit="pounds">210</weight>
        <measurements unit="inches">
            <height>71.5</height>
            <reach>73.5</reach>        
            <biceps>15.5</biceps>
            <chest>
                <normal>43</normal>
                <expanded>45</expanded>
            </chest>    
            <waist>34.5</waist>
            <thigh>26.5</thigh>
            <neck>18</neck>
            <calf>15</calf>
        </measurements>
    </fighter>
    <fighter name="Muhammad Ali">
        <age>33</age>
        <weight unit="pounds">220</weight>
        <measurements unit="inches">
            <height>75</height>
            <reach>80</reach>        
            <biceps>15</biceps>
            <chest>
                <normal>44</normal>
                <expanded>46</expanded>
            </chest>    
            <waist>34</waist>
            <thigh>26</thigh>
            <neck>17.5</neck>
            <calf>17</calf>
        </measurements>
    </fighter>    
</fight>

In JSON, it might look like this:

{
  "location": "Manila, The Philippines",
  "date": "September 30, 1975",
  "fighters": [
    {
      "name": "Joe Frazier",
      "nicknames": [
        "Smokin' Joe"
      ],
      "hometown": "Philadelphia, PA",
      "age": 31,
      "weight": 210,
      "measurements": {
        "height": 71.5,
        "reach": 73.5,
        "biceps": 15.5,
        "chest": {
          "normal": 43,
          "expanded": 45
        },
        "waist": 34.5,
        "thigh": 26.5,
        "neck": 18,
        "calf": 15
      }
    },
    {
      "name": "Muhammad Ali",
      "nicknames": [
        "The Louisville Lip",
        "The Greatest"
      ],
      "hometown": "Louisville, KY",
      "age": 33,
      "weight": 220,
      "measurements": {
        "height": 75,
        "reach": 80,
        "biceps": 15,
        "chest": {
          "normal": 44,
          "expanded": 46
        },
        "waist": 34,
        "thigh": 26,
        "neck": 17.5,
        "calf": 17
      }
    }
  ]
}

Notice that the fight has three properties: the location, the date, and the fighters. The value of “fighters” is an array (a list) with two items. Each of those items is itself an object describing the individual fighter’s characteristics. Most of that data is just a number, but, for example, “nicknames” is an array because a boxer can have any number of nicknames. If you knew every boxer would have exactly one nickname, you wouldn’t need to make that an array.

Creating XML & JSON

This primer is mostly designed for you to loosely understand the structure of XML & JSON. Being able to create XML or JSON requires a more detailed and nitpicky understanding of the syntax. In the meantime, if you have tabular data (e.g. an Excel file), and you want to turn it into XML or JSON, or you just want to see what it looks like as XML/JSON for learning purposes, Mr. Data Converter is a great resource.

Flattr this!

Web APIs for non-programmers

- November 18, 2013 in HowTo

New elevator

Photo credit: Jason Kuffer

School of Data is re-publishing Noah Veltman‘s Learning Lunches, a series of tutorials that demystify technical subjects relevant to the data journalism newsroom.

This Learning Lunch is about web APIs, a powerful way to gain direct access to data.

What is an API?

API stands for Application Programming Interface. Don’t worry about the AP, just focus on the I. An API is an interface. You use interfaces all the time. A computer operating system is an interface. Buttons in an elevator are an interface. A gas pedal in a car is an interface.

An interface sits on top of a complicated system and simplifies certain tasks, a middleman that saves you from needing to know all the details of what’s happening under the hood. A web API is the same sort of thing. It sits on top of a web service, like Twitter or YouTube, and simplifies certain tasks for you. It translates your actions into the technical details for the computer system on the other end.

What is a web API?

There are lots of different flavors of web API. One of the most common, and most accessible to non-programmers, is called a REST, or RESTful, API. From now on, when I say “web API” I mean a REST API. If you want to nitpick, there are other kinds of web API. But why would you want to do that?

A web API is an interface with URLs as the controls. In that respect, the entire web is a sort of API. You try to access a URL in your browser (also known as a request), and a web server somewhere makes a bunch of complicated decisions based on that and sends you back some content (also known as a response). A standard web API works the same way.

The key difference between an ordinary URL and a URL that’s part of a web API is that an ordinary URL sends back something pretty designed to look good in your browser, whereas a web API URL sends back something ugly designed to be useful to a computer.

When you request the URL http://twitter.com/ in a browser you get back a nice-looking webpage with a bunch of colors and pictures and buttons. It’s designed for a human to look at and for a browser to draw on a screen. But it sucks if what you want is to gather and analyzing data. The structure of the underlying document is very confusing and inconsistent. It’s hard to extract the bits you care about, and it doesn’t provide you information in bulk.

When you request this web API URL instead, you get back an ugly-looking chunk of plain text with no decorations:

https://api.twitter.com/1.1/statuses/home_timeline.json

It’s designed for a computer to read. It sucks if what you want is to look at some tweets while you drink your morning coffee, but it’s great if you want to extract and analyze tweets and their metadata, especially if you want to extract a lot of them at one time.

Web APIs are a way to strip away all the extraneous visual interface that you don’t care about and get at the data. In the same vein, you can often think of them as a limited shortcut into a web service’s database. Twitter won’t just let you log in to their internal database and poke around (unless you work there), but they will give you an easier way to access it in certain limited ways using an API.

Why would I want to use a web API?

  1. To get information that would be time-consuming to get otherwise. Most often, you could get some data from a website manually. You could sit there and click through 100 pages and copy/paste it into a spreadsheet (or make your intern do it). If you’re a programmer, you could spend a lot of time figuring out how a page is structured and write a custom scraper to get the data out. Either way, it would take a long time and be really aggravating. In cases like this, an API is a time-saver that lets you get what you want quickly instead.
    Example: you want every public photo on Flickr that has the tag ‘maui,’ was taken with a Nikon camera in 2012, and is wider than it is tall. You could sit there and run the search on Flickr, and then click through all the results one at a time, finding the right ones and copying them to a list. It would take hours. If you use the Flickr API, you can get much more specific about what you want, and instead of getting back a gallery you have to click through one-by-one, you get back a big text list with all the details.
  2. To get information that you can’t get otherwise. Sometimes web APIs give you a way to access information that doesn’t exist on the normal web, stuff that’s in a database attic somewhere or that’s hidden from normal users because normal users wouldn’t care about it (as a journalist, there are probably lots of things you care about that a casual web user doesn’t).
    Examples: Twitter might not display tweets before a certain date on its website, but still allow you to download them via the API. The Rotten Tomatoes API might give you extra metadata on release dates that’s not displayed on the website.
  3. To automate a news app that needs live data from other sources.
    Example: you want your Super Bowl coverage to include a live stream of every Instagram photo taken near the stadium.
  4. To use it as a more direct interface for reading and writing data to a service.
    Example: you use MailChimp to manage all of your mailing lists. You want to be able to automatically add and remove people from lists when certain things happen instead of someone having to manually manage those lists.

Reasons #1 and #2 are both ways in which a non-coding journalist can still make their life easier by retrieving data in bulk or with great specificity. Reasons #3 and #4 both generally require some programming savvy.

OK, so how does it work?

The basics

First, you need to figure out whether the data you’re interested in is available through an API. The easiest way to do this is by Googling, but you can also look for an ‘API’ or ‘Developers’ link on a web service’s homepage (it’s often buried at the bottom of the page). Sometimes there is an “unofficial” or “undocumented” API for a site that was built by someone else; the reliability of a service like that is a question mark, so caveat usor.

Usually you’ll find a set of documentation, sometimes called an API specification. This is the API’s instruction manual. It tells you what all the controls do. Here are a few examples:

The Twitter API: https://dev.twitter.com/docs/api/1.1
The New York Times Best Sellers API: http://developer.nytimes.com/docs/best_sellers_api/

These instruction manuals are very dense with information, but what they mainly describe is a list of URLs you can use to retrieve data. These URLs can called many things, like resources or methods. Using one of them is also sometimes called an API request or API call. A “request” is a good way to think about it, because that’s exactly what you’re doing. You’re going up to the friendly librarian at Twitter or YouTube or whatever other popular service, and asking them to give you some information.

For each URL, you will usually find a page or a section explaining more details about how to use it. Typically this consists of two things: parameters and the response.

Parameters

Parameters are information you can supply as part of the URL in order to define what you want. For example, if you’re running a search with the Twitter API, the URL might be:

https://api.twitter.com/1.1/search/tweets.json

but this doesn’t tell Twitter anything about what you want to search for. You have to add in parameters, like so:

https://api.twitter.com/1.1/search/tweets.json?q=burritos

in order to specify that you are searching for ‘burritos’.

Parameters might also be called variables, because they vary – they are the parts of a URL that you change in order to change what you’re asking for. Think of each web API resource/method/URL as a gadget, and each parameter as a specific knob on that gadget.

For any given URL, some parameters might be required, some might be optional. Let’s go back to the Twitter search example:

https://api.twitter.com/1.1/search/tweets.json?q=burritos

The q parameter that gives it a word to search for is a required parameter. If you don’t supply one, the API won’t accept your request because you’re searching without telling it what to search for. There are lots of other optional parameters, though. For example, if you add a lang parameter, you’re telling it you only want results that are in a certain language. This would do the same search, but only bring back results in English:

https://api.twitter.com/1.1/search/tweets.json?q=burritos&lang=en

That’s just the tip of the iceberg. For any given URL, there are usually lots of optional parameters that will further refine what you’re doing. The instructions will probably list what the default is for every parameter you don’t specify. This is important. For example, the default number of results for the search above is 15. If you want more than 15 at a time, you have to specify that:

https://api.twitter.com/1.1/search/tweets.json?q=burritos&lang=en&count=100

Parameters specify things like:

  • How many results do you want back at once?
  • How do you want the results to be sorted?
  • What date range do you want to search?
  • What location do you want to search?
  • What format do you want the results in?

You may be wondering about how those parameters end up slapped on to the end of the URL in these examples. We’ll talk about that more in a second, in the GET and POST section.

The Response

When you use a web API, you supply a URL (possibly with some extra parameters), and you most likely get back a response. The response can be one of two things:

  • Some data – this is what you want.
  • An explanation of why your request failed – this might tell you that you failed to supply a required parameter, you’re over your rate limit (see below), you need to supply authentication to make that particular request (see below), or there was some other problem with the request.

The documentation should give you some information about sort of response gets sent back for each type of request. Here’s an example of a response you would get if you used the Rotten Tomatoes API in order to search for ‘skyfall’:

{"total":1,"movies":[{"id":"770680844","title":"Skyfall","year":2012,"mpaa_rating":"PG-13","runtime":145,"critics_consensus":"Sam Mendes brings Bond surging back with a smart, sexy, riveting action thriller that qualifies as one of the best 007 films to date.","release_dates":{"theater":"2012-11-09","dvd":"2013-03-11"},"ratings":{"critics_rating":"Certified Fresh","critics_score":92,"audience_rating":"Upright","audience_score":88},"synopsis":"In Skyfall, Bond's loyalty to M is tested as her past comes back to haunt her. As MI6 comes under attack, 007 must track down and destroy the threat, no matter how personal the cost. -- (C) Official Site","posters":{"thumbnail":"http://content9.flixster.com/movie/11/16/82/11168295_mob.jpg","profile":"http://content9.flixster.com/movie/11/16/82/11168295_pro.jpg","detailed":"http://content9.flixster.com/movie/11/16/82/11168295_det.jpg","original":"http://content9.flixster.com/movie/11/16/82/11168295_ori.jpg"},"abridged_cast":[{"name":"Daniel Craig","id":"162687443","characters":["James Bond"]},{"name":"Judi Dench","id":"162652435","characters":["M"]},{"name":"Javier Bardem","id":"162661456","characters":["Silva"]},{"name":"Ralph Fiennes","id":"162653681","characters":["Gareth Mallory","Mallory"]},{"name":"Naomie Harris","id":"162705781","characters":["Eve"]}],"alternate_ids":{"imdb":"1074638"},"links":{"self":"http://api.rottentomatoes.com/api/public/v1.0/movies/770680844.json","alternate":"http://www.rottentomatoes.com/m/skyfall/","cast":"http://api.rottentomatoes.com/api/public/v1.0/movies/770680844/cast.json","clips":"http://api.rottentomatoes.com/api/public/v1.0/movies/770680844/clips.json","reviews":"http://api.rottentomatoes.com/api/public/v1.0/movies/770680844/reviews.json","similar":"http://api.rottentomatoes.com/api/public/v1.0/movies/770680844/similar.json"}}],"links":{"self":"http://api.rottentomatoes.com/api/public/v1.0/movies.json?q=Skyfall&page_limit=1&page=1"},"link_template":"http://api.rottentomatoes.com/api/public/v1.0/movies.json?q={search-term}&page_limit={results-per-page}&page={page-number}"}

That’s pretty unhelpful, right? It’s a dense mess, the data equivalent of meatloaf. Let’s unpack it a little by adding indentation:

{
   "total":1,
   "movies":[
      {
         "id":"770680844",
         "title":"Skyfall",
         "year":2012,
         "mpaa_rating":"PG-13",
         "runtime":145,
         "critics_consensus":"Sam Mendes brings Bond surging back with a smart, sexy, riveting action thriller that qualifies as one of the best 007 films to date.",
         "release_dates":{
            "theater":"2012-11-09",
            "dvd":"2013-03-11"
         },
         "ratings":{
            "critics_rating":"Certified Fresh",
            "critics_score":92,
            "audience_rating":"Upright",
            "audience_score":88
         },
         "synopsis":"In Skyfall, Bond's loyalty to M is tested as her past comes back to haunt her. As MI6 comes under attack, 007 must track down and destroy the threat, no matter how personal the cost. -- (C) Official Site",
         "posters":{
            "thumbnail":"http://content9.flixster.com/movie/11/16/82/11168295_mob.jpg",
            "profile":"http://content9.flixster.com/movie/11/16/82/11168295_pro.jpg",
            "detailed":"http://content9.flixster.com/movie/11/16/82/11168295_det.jpg",
            "original":"http://content9.flixster.com/movie/11/16/82/11168295_ori.jpg"
         },
         "abridged_cast":[
            {
               "name":"Daniel Craig",
               "id":"162687443",
               "characters":[
                  "James Bond"
               ]
            },
            {
               "name":"Judi Dench",
               "id":"162652435",
               "characters":[
                  "M"
               ]
            },
            {
               "name":"Javier Bardem",
               "id":"162661456",
               "characters":[
                  "Silva"
               ]
            },
            {
               "name":"Ralph Fiennes",
               "id":"162653681",
               "characters":[
                  "Gareth Mallory",
                  "Mallory"
               ]
            },
            {
               "name":"Naomie Harris",
               "id":"162705781",
               "characters":[
                  "Eve"
               ]
            }
         ],
         "alternate_ids":{
            "imdb":"1074638"
         },
         "links":{
            "self":"http://api.rottentomatoes.com/api/public/v1.0/movies/770680844.json",
            "alternate":"http://www.rottentomatoes.com/m/skyfall/",
            "cast":"http://api.rottentomatoes.com/api/public/v1.0/movies/770680844/cast.json",
            "clips":"http://api.rottentomatoes.com/api/public/v1.0/movies/770680844/clips.json",
            "reviews":"http://api.rottentomatoes.com/api/public/v1.0/movies/770680844/reviews.json",
            "similar":"http://api.rottentomatoes.com/api/public/v1.0/movies/770680844/similar.json"
         }
      }
   ],
   "links":{
      "self":"http://api.rottentomatoes.com/api/public/v1.0/movies.json?q=Skyfall&page_limit=1&page=1"
   },
   "link_template":"http://api.rottentomatoes.com/api/public/v1.0/movies.json?q={search-term}&page_limit={results-per-page}&page={page-number}"
}

Now it starts to make a little more sense. Don’t worry about all the brackets and commas just yet. You can see broadly that you’re getting back some basic info about the movie Skyfall: its ratings, its release date, its cast, etc.

When you get a response back with data, it will almost always be in one of two formats: XML or JSON. In order to get much use out of this data, you’ll need to wrap your head around how these two formats express data. To learn more, read XML and JSON.

GET vs. POST

For any API method/resource/URL that involves parameters, you will typically supply them in one of three ways:

Modifying the URL itself
Often times the URL for an API includes parts of the URL that can be changed themselves. For example, a URL might be listed as:

http://www.api.com/list/[page number]/[sort by]/[format]/

In this case, to get different variations, you would modify the URL accordingly:

http://api.ebay.com/list/1/price/xml/ (Get page 1, sorted by price, in XML format)
http://api.ebay.com/list/5/date/json/ (Get page 5, sorted by date, in JSON format)

Adding GET parameters onto the end of a URL
This is a slight variation on the version above. When you look at a URL with a question mark followed by a bunch of junk, everything after the question mark is a list of GET parameters. Each one has a name and a value, like so:

?name=value&name=value&name=value...

For example, in this URL:

http://www.google.com/search?query=ducktales&language=english

You are supplying two extra parameters:

  • A parameter called query with the value ducktales
  • A parameter called language with the value english

Most popular web APIs use this mechanism as a way of supplying parameters for looking something up or getting a list. They give you a base URL and then you add on extra GET parameters. For example:

http://api.yelp.com/v2/search?term=burritos&location=Chicago
https://api.foursquare.com/v2/venues/search?query=burritos&near=Chicago

Sending POST variables
If the documentation tells you that you have to use the POST method of making a request, you’ve got some problems. POST is a way to send hidden data as part of a request, data that doesn’t get listed as part of the URL. You use POST all the time when you use the web. When you fill out a form to buy something online, it submits your payment information using POST, because it would be bad if you loaded a URL that put that information out in the open, like:

http://www.amazon.com/checkout?creditcardnumber=1234567812345678

POST is generally used for ephemeral or sensitive things that you don’t want to have a permanent URL for, like things that modify data in a database.

Let’s imagine you have a page where someone submits a form with their email address to be added to a list. If that data gets passed via GET:

http://mailinglist.com/[email protected]

and John Smith accidentally shares that URL with others, they will all re-initiate that action when they load the URL. John will get added to the list over and over. If you instead send it as POST parameters to the URL:

http://mailinglist.com/add

John won’t be able to reproduce that action without filling out the form again.

If an API method you need requires to send parameters via POST, you can still do it without writing any code, but it’s a little more complicated, because you can’t just do it in the browser address bar. You can use a program like Fiddler or browser extensions like Postman or REST Client. These will allow you to add POST parameters to a request.

API keys

Some APIs are genuinely public, open to all. When you find an API like this, you can just take an API URL, add some parameters, put it into your browser, and you’ll get back a useful response. An example of this is the old Twitter API. You can just put a URL like this into your browser and get results:

https://search.twitter.com/search.json?q=burritos

Go ahead, try it!

These days, most APIs are not quite that freewheeling. Instead, most of them require some sort of authentication, often in the form of an API key, a long string of letters and numbers that functions like a password. The bad news is that in order to use these APIs, you have to do a little extra work, filling out a form to request access first. The good news is, this process is usually quite quick, and plenty of APIs are still free even though they require an API key.

For example, if you try to search for ‘skyfall’ in the Rotten Tomatoes API without an API key:

http://api.rottentomatoes.com/api/public/v1.0/movies.json?q=Skyfall

You’ll get back this response:

{"error":"Account Inactive"}

If you supply an API key as a parameter with your request, like this:

http://api.rottentomatoes.com/api/public/v1.0/movies.json?q=Skyfall&apikey=krw98sa2

You’ll get what you want.

As long as you can supply the API key as a parameter with the URL, you can still make requests. If you have to authenticate in some other way, you might be out of luck without a little bit of programming.

Rate limiting

Many APIs include limits on how many requests you can make per hour or per day in order to prevent you from overloading their servers. If you aren’t a programmer, these limits probably won’t be an issue. They are there to prevent you from automating a flurry of thousands of requests. For information on rate limits, see a particular API’s documentation. Note also that lots of APIs are free up to a certain rate limit and then charge you money if you want to exceed it.

An example API workflow for a non-programmer

  1. I want some data from service X. Does service X have an API? Hooray, it does, and it’s free!
  2. Look at the API documentation. Figure out if there is a URL that retrieves the kind of data you’re looking for. There is? Great!
  3. Sign up for an API key if one is required.
  4. Figure out what parameters you need to include in the URL in order to get the exact data you want.
  5. Load the URL, parameters included, into your browser. Get back a response! If it didn’t work, go back to step 4.
  6. Take that data and unpack it. For more on this, read XML and JSON.

Disclaimer

APIs are very useful for getting data on a one-off basis, especially if you can master XML and JSON, but be wary about building ongoing processes on them. There is no guarantee that an API won’t change. APIs or specific parts of them are discontinued all the time, making it harder to get data that used to be easy to get. Or, the service starts charging a lot of money to use the API now that everyone relies on it. Keep this in mind when thinking about how you want to use a particular API.

Some popular free web APIs

New York Times
Yelp
Twitter
Flickr
Foursquare
Instagram
LinkedIn
Vimeo
Tumblr
Google Books
Facebook
Google+
YouTube
Rotten Tomatoes

A long list of REST APIs: http://www.programmableweb.com/apis/directory/1?protocol=REST

Flattr this!

Avoiding mistakes when cleaning your data

- November 14, 2013 in HowTo

World Cleanup 2012 - Slovenia

Photo credit: Earth Day Pictures

School of Data is re-publishing Noah Veltman‘s Learning Lunches, a series of tutorials that demystify technical subjects relevant to the data journalism newsroom.

This Learning Lunch is about cleaning up data: what to do and, more importantly, what not to do.

One of the most important and oft-neglected steps in any data journalism project is cleaning up raw data. Almost always, when you first get the data you want (or the data you’ve settled for), it’s not yet usable. It’s riddled with inconsistencies and doesn’t express the relationships you want to analyze. You don’t fully understand its parameters yet. Before you can make it interesting, you need to field strip it and put it back together.

This process is dangerous; there are lots of ways to go wrong and make mistakes without even realizing it. When you screw up your data in the process of cleaning it, the best-case scenario is that you waste a lot of time, but the worst-case scenario is that your ultimate analysis will be wrong because you’ve unknowingly changed the data.

Here are some guiding principles to consider whenever you’re about to start cleaning up and reshaping raw data for analysis.

Don’t change your original files/tables

If you have a big Excel file or a MySQL table that needs cleaning, don’t just go in there and start drilling holes in the wall. Make a copy and work on that instead. It will make it easier to start over if you screwed up, and, more importantly, you can compare what you’ve got at different stages of cleaning and mutation to make sure it matches up not just with the previous step in your cleaning but with the starting data.

As a corollary to this, you shouldn’t throw away data just because you think you don’t need it. Be a bit of a digital packrat. Keep things around, but also keep them clearly labeled so you don’t mistake one file for another.

Spot check everything

As soon as your dataset is large enough that you can’t read it all line-by-line (which is to say, just about every dataset), you have to start spot checking. Any assumptions you have about the nature and consistency of the data are just a guess, and they’re probably wrong. SELECT * FROM \`TABLE\` ORDER BY 1 LIMIT 5 is one my most frequent SQL statements (for non-SQL people: “show me 5 random rows from the table”). Use it, love it. Get a few random records at a time and read them closely. See if anything seems off. Do this early and often. It will prevent dumb mistakes, but there’s also a bonus: it will give you much better insight into your data.

Check for weird values

Look out for empty values, and especially for pseudo-empty values. Excel files from government agencies are unendingly creative when it comes to weird placeholder characters, and you’ll get data that uses - or * or ~ to fill a blank space. For bonus points, check for extreme value lengths too. If most of the street addresses in your data are about 75 characters long and one of them is 450 characters long, strange things are afoot at the Circle K.

For every categorical column, check the list of values that exist in the data. Make sure everything that should be there is, and anything that shouldn’t be isn’t. GROUP BY (or its twin SELECT DISTINCT) should become your new best friend. For every numerical column, at least sanity check mins and maxes. Check the ranges of every special data type (e.g. ZIP codes). Don’t assume that all dates will be formatted the same, or even be dates.

When you’re GROUPing things, use COUNT() to see how many items there are in each category. See if all the numbers pass your basic smell test. If they don’t, you probably screwed something up, but if you’re lucky it means there’s a story there. Either way, you want to know.

Text data sucks. Be careful about whitespace, capitalization, and character collation in text columns. There could be random whitespace in your cells that breaks your ability to compare or group them. You know that “Paris” and “Paris ” are the same, but your database doesn’t. Use TRIM() where it’s reasonable to do so. And remember Veltman’s Law of Character Sets:

Veltman’s Law of Character Sets: there will be exactly one é somewhere in your data and you won’t find it until it ruins everything.

Worry about your column types

Whether you’re using Excel, a relational database, or something else, make sure that your columns/fields are the type you want, and all of the data going in matches those types. If you don’t, your data is going to get squeezed through a special decorative mold when you import it and all your candy cane integers will become snowflake text and you won’t even know it’s happening. This is especially important if your data is going to pulled out the other side later to power some sort of cool app, where it’s going to go through the variable type wringer again.

Pop quiz: which of the following things evaluate as false in whatever language your developers use?
0, “0”, 0.0, “0.0”, [], {}, [{}], null, undefined

Answer: don’t let this question come up.

Do dry runs before you change things

Are you changing all 50,000 rows in a table with a complicated UPDATE statement? Try updating a few of them first and inspecting the results. Make sure your clever operation with five nested REPLACE()s and an inscrutable WHERE clause does what you think it does. Or maybe you’re auto-generating a thousand database queries with a nifty script you wrote. Run a version that prints the queries without executing them first and read the output. SELECT liberally, INSERT and UPDATE conservatively.

Clear is better than clever

There’s no prize for writing the world’s most beautiful JOIN or most deeply-nested Excel formula, so don’t try. If you’re a journalist trying to whip some data into shape, it doesn’t matter if you take a few extra computing cycles. You are not working with Big Data. Processing power is cheap. Storage is cheap. Your time is not. Trying to be clever will make things harder to understand for you and for others, and it increases the chances that you’ll do something really stupid. When clever things fail, they tend to fail insidiously (I’m looking at you, crazy regexes). Keep your operations simple. Work stepwise. Break complicated operations into multiple simple ones. It creates a better trail so that when the results are all screwed up (they will be), you can figure out why.

Keep track of what you’re doing

Out of any piece of advice on this list, this is the one I’ve most consistently failed to heed. Don’t be like me. Keep a log of what you’re doing to the data. It can be a paper notebook or a slick automatic query logger or file version control with commit messages or a friendly parrot. It doesn’t matter. Knowing what exactly you’ve done to your data is important for troubleshooting and undoing mistakes, but it’s essential for quality journalism.

Flattr this!

So you want to make a map…

- November 9, 2013 in HowTo

Antique map of the world

Image credit: Rosario Fiore

School of Data is re-publishing Noah Veltman‘s Learning Lunches, a series of tutorials that demystify technical subjects relevant to the data journalism newsroom.

This Learning Lunch is about using geographic data to make maps for the web.

Are you sure?

Just because something can be represented geographically doesn’t mean it should. The relevant story may have nothing to do with geography. Maps have biases. Maps can be misleading. They may emphasize land area in a way that obscures population density, or show “geographic” patterns that merely demonstrate an underlying demographic pattern. Before you proceed, make sure a map is what you actually want.

For a more detailed take on this question, read When Maps Shouldn’t Be Maps.

What maps are made of

Maps generally consist of geographic data (we’ll call this geodata for short) and a system for visually representing that data.

Part 1: Geodata

Latitude and Longitude

Most geodata you encounter is based on latitude/longitude coordinates on Earth’s surface (mapping Mars is beyond the scope of this primer).

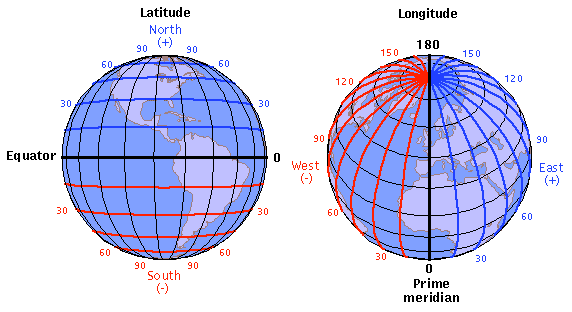
Latitude ranges from -90 (the South Pole) to 90 (the North Pole), with 0 being the equator.

Longitude ranges from -180 (halfway around the world going west from the prime meridian) to 180 (halfway around the world going east from the prime meridian), with 0 being the prime meridian. Yes, that means -180 and 180 are the same.

Latitude/Longitude

If you are an old-timey sea captain, you may find or write latitude and longitude in degrees + minutes + seconds, like:

37°46'42"N, 122°23'22"W

Computers are not old-timey sea captains, so it’s easier to give them decimals:

37.77833, -122.38944

A latitude/longitude number pair is often called a lat/lng or a lat/lon. We’ll call them lat/lngs.

Want to quickly see where a lat/lng pair is on earth? Enter it into Google Maps, just like an address.

* Sometimes mapping software wants you to give a lat/lng with the latitude first, sometimes it wants you to give it with the longitude first. Check the documentation for whatever you’re using (or, if you’re lazy like me, just try it both ways and then see which one is right).

* Precision matters, so be careful with rounding lat/lngs. At the equator, one degree of longitude is about 69 miles!

Map geometry

Almost any geographic feature can be expressed as a sequence of lat/lng points. They are the atomic building blocks of a map.

A location (e.g. a dot on a map) is a single lat/lng point:

37.77833,-122.38944

Point

A straight line (e.g. a street on a map) is a pair of lat/lng points, one for the start and one for the end:

37.77833,-122.38944 to 34.07361,-118.24

Line

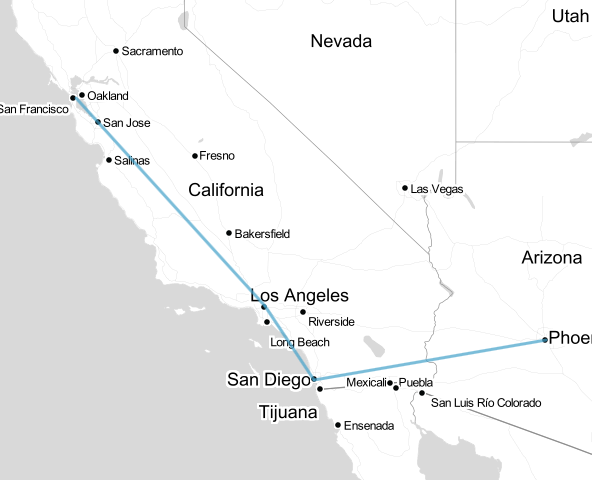
A jagged line, sometimes called a polyline, is a list of straight lines in order, a.k.a. a list of pairs of lat/lng points:

37.77833,-122.38944 to 34.07361,-118.24
34.07361,-118.24 to 32.7073,-117.1566
32.7073,-117.1566 to 33.445,-112.067

Polyline

A closed region (e.g. a country on a map) is just a special kind of jagged line that ends where it starts. These are typically called polygons:

37.77833,-122.38944 to 34.07361,-118.24
34.07361,-118.24 to 32.7073,-117.1566
32.7073,-117.1566 to 33.445,-112.067
33.445,-112.067 to 37.77833,-122.38944

Polygon

The bottom line: almost any geodata you find, whether it represents every country in the world, a list of nearby post offices, or a set of driving directions, is ultimately a bunch of lists of lat/lngs.

Map features

Most common formats for geodata think in terms of features. A feature can be anything: a country, a city, a street, a traffic light, a house, a lake, or anything else that exists in a fixed physical location. A feature has geometry and properties.

A feature’s geometry consists of any combination of geometric elements like the ones listed above. So geodata for the countries of the world consists of about 200 features.* Each feature consists of a list of points to draw a jagged line step-by-step around the perimeter of the country back to the starting point, also known as a polygon. But wait, not every country is a single shape, you say! What about islands? No problem. Just add additional polygons for every unconnected landmass. By combining relatively simple geometric elements in complex ways, you can represent just about anything.

Let’s say you have the Hawaiian islands, each of which is represented as a polygon. Should that be seven features or one?* It depends on what kind of map we’re making. If we are analyzing something by state, we only care about the islands as a group and they’ll all be styled the same in the end. They should probably be a single feature with seven pieces of geometry. If, on the other hand, we are doing a map of Hawaiian wildlife by island, we need them to be seven separate features. There is also something called a “feature collection,” where you can loosely group multiple features for certain purposes, but let’s not worry about that for now.

A feature’s properties are everything else that matter for your map. For the countries of the world, you probably want their names, but you may also want things like birth rate, population, largest export, or whatever else is going to be involved in your map.

* One of the lessons you will learn when you start making maps is that questions that you thought had simple answers – like “What counts as a country?” and “How many Hawaiian islands are there?” – get a little complicated.

Geodata formats

So we’ve learned that geodata is a list of features, and each feature is a list of geometric pieces, and each geometric piece is a list of lat/lngs, so the whole thing looks something like this:

Feature #1:
    geometry:
        polygon #1: [list of lat/lngs]
        polygon #2: [list of lat/lngs] (for Easter Island)
        ...
    properties:
        name: Chile
        capital: Santiago
        ...
Feature #2:
    geometry:
        polygon #1: [list of lat/lngs]
        polygon #2: [list of lat/lngs]
        ...
    properties:
        name: Argentina
        capital: Buenos Aires
        ...

So we just need a big list of lat/lng points and then we can all go home, right? Of course not. In the real world, this data needs to come in some sort of consistent format a computer likes. Ideally it will also be a format a human can read, but let’s not get greedy.

Now that you know that geodata is structured like this, you will see that most common formats are very similar under the hood. Four big ones that you will probably come across are:

Shapefiles

This is the most common format for detailed map data. A “shapefile” is actually a set of files:

  • .shp — The geometry for all the features.
  • .shx — A helper file that stores what order the shapes should be in.
  • .dbf — stores the properties of each feature in a spreadsheet-like format.
  • Other optional files storing things like a project description and styling (only the above three files are required).

If you open a shapefile in a text editor, it will look like gibberish, but it will play really nicely with desktop mapping software, also called GIS software or geospatial software. Shapefiles are great for doing lots of detailed manipulation and inspection of geodata. By themselves, they are pretty lousy for making web maps, but fortunately it’s usually easy to convert them into a different format.

GeoJSON

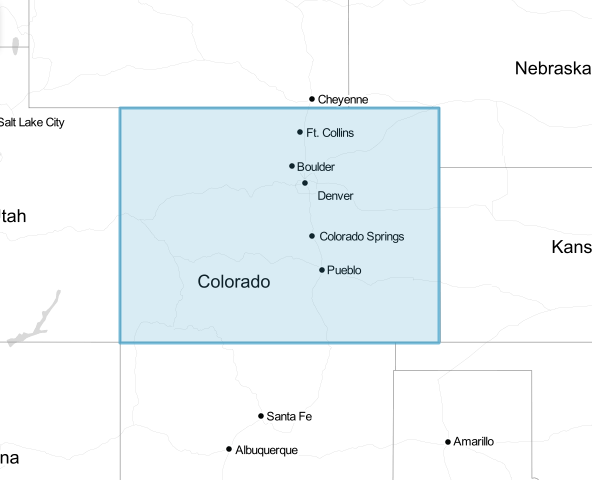
A specific flavor of JSON that is great for web mapping. It’s also fairly human readable if you open it in a text editor. Let’s use the state of Colorado as an example, because it’s nice and rectangular.

{
  "type": "Feature",
  "geometry": {
    "type": "Polygon",
    "coordinates": [
      [
        [-102.04,36.99],
        [-102.04,40.99],
        [-109.05,40.99],
        [-109.05,36.99],
        [-102.04,36.99]
      ]
    ]
  },
  "properties": {
    "name": “Colorado"
    “capital”: “Denver”
  }
}

This means: Draw a polygon by starting from the first point ([-102.04,36.99]), drawing a line to the next point ([-102.04,40.99]), and repeating until the end of the list.

Notice that the last point is the same as the first point, closing the loop – most software doesn’t require this extra point and will close the loop for you.

KML

A specific flavor of XML that is heavily favored by Google Maps, Google Earth, and Google Fusion Tables. The basic components behave very similarly to GeoJSON, but are contained in XML tags instead of curly braces. KML supports lots of extra bells and whistles like camera positioning and altitude for making movies in Google Earth. It plugs really nicely into Google products, but generally needs to be converted to something else in order to make other web maps. So what does Colorado look like in KML?

<Polygon id="Colorado">
    <altitudeMode>clampToGround</altitudeMode>
    <outerBoundaryIs>
        <LinearRing>
            <coordinates>
                -102.04,36.99
                -102.04,40.99
                -109.05,40.99
                -109.05,36.99
                -102.04,36.99
            </coordinates>
        </LinearRing>
    </outerBoundaryIs>
</Polygon>

The XML tags can be very confusing, but note that the meat of this data is quite similar to the GeoJSON example. Both of them are just a list of points in order, with a lot of scary braces and brackets as window dressing.

TopoJSON

The new hotness. TopoJSON takes in a basic geodata format, like GeoJSON, and spits out a clever reduction of it by focusing on the part of a map we usually care about: borders and connections (a.k.a. topology). The details are beyond the scope of this primer, but you can read about the TopoJSON magic here: https://github.com/mbostock/topojson/wiki

Remember: different software accepts different file formats for geodata, but at the end of the day everyone speaks lat/lng. Different file formats are just dialects of the mother tongue.

I’m not a cartographer. Where do I get geodata I can actually use?

There are lots of good sources for geodata online. Here are a few helpful sources:

Natural Earth
http://www.naturalearthdata.com/
Offers shapefile downloads of a few different data sets for the entire earth: Cultural (country boundaries, state/province boundaries, roads, railroads, cities, airports, parks, etc.) and Physical (coastline, islands, rivers, lakes, glaciers, etc.).

US Census Bureau
http://www.census.gov/geo/maps-data/data/tiger.html
Detailed shapefiles or KML files for the entire US.

Geocommons
http://geocommons.com/
A wide variety of user-contributed geodata, easy to search, browse, or preview. Data reliability may vary.

Wikimedia Commons
http://commons.wikimedia.org/
Lots of detailed maps in SVG format, which can be easily used and modified for the web (see “SVG/Canvas Maps” below).

OpenStreetMap
http://www.openstreetmap.org/
A well-populated database of land, boundaries, roads, and landmarks for the entire earth. This is available as a special XML format, and has to be converted to be used with most software. Because it covers the whole earth and has good coverage of roads, points of interest, etc., it is often used to generate a whole-earth set of map tiles (see “Slippy Maps” below).

Google
http://www.google.com/
If you don’t have the map data you need, look around! You’d be surprised how much is out there once you start looking.

ogr2ogr Converter
http://ogre.adc4gis.com/
Not a source of data, but a handy converter if you need to convert between a shapefile and GeoJSON.

Desktop GIS Software
http://www.qgis.org/ (free)
http://www.esri.com/software/arcgis (very not free)
You’ll want to start getting the hang of desktop GIS software, especially if you’ll be working with shapefiles. Quantum GIS is free and excellent. Arc GIS is also very powerful but very expensive. These are not a data source, per se, but an important method of whipping imperfect data into shape before mapping it.

A note of caution: be distrustful of any geographic data you find, especially if it’s complex or you’ll be combining data from multiple sources. Geographic data is not immune to the variability of accuracy on the internet. You will find no shortage of misshapen shapefiles, mislabeled locations, and missing puzzle pieces.


Part 2: Turning Geodata Into A Web Map

The point of all this data drudgery is to make a cool map, right? So let’s forget about the curly braces and the geometry lessons and get to it. Broadly speaking, you have three options for mapping your data for display on the web. Before we look at them, make sure you ask yourself the following question:

Does my map need to be interactive?
Just because you can make your map interactive and animated doesn’t mean you should. Some of the best maps in the news are just images. Images are great for the web because virtually everything supports them. This isn’t exactly an alternative to other methods, because in order to make an image, you’ll need to make a map with something else first: desktop GIS software, Adobe Illustrator, or one of the three options below. Once you have the display you want, you can either take a screenshot or export it as an image. Even still, avoiding unnecessary interactivity and complexity in favor of flat images will cut down on a lot of mapping headaches.

Option 1: Slippy Maps

An example of a slippy map

Whether you know it or not, you’ve used a lot of slippy maps. Google Maps is a slippy map. Yahoo! Maps is a slippy map. Does MapQuest still exist? If so, it’s probably a slippy map. I’m using the term “slippy” to refer to a web map with a background layer that “slips” around smoothly, allowing you to pan and zoom to your heart’s content. The underlying magic of a slippy map is a set of tiles in the background that are just flat images, so you could also call them tile-based maps. At each zoom level, the entire globe is divided into a giant grid of squares. Wherever you are on the map, it loads images for the squares you’re looking at, and starts loading nearby tiles in case you move around. When you move the map, it loads the new ones you need. You can add other layers and clickable objects on top of the tiles, but they are the basic guts of a slippy map.

How tiles work

Slippy maps are great because:

  1. They’re easy on browsers and bandwidth. They only need to load the part of the world you’re looking at, and they’re image-based. Every major browser and device supports them.
  2. People are used to them. Thanks to the popularity of Google Maps, everyone has lots of practice using slippy maps.
  3. They’re pretty easy to make responsive to screen size. Just shrink the map box, the underlying tiles don’t change.
  4. They gracefully support most key mapping features, like zooming, panning, and adding markers. They keep track of the messy details so you can focus on geography.

Slippy maps are not great because:

  1. Generating your own tiles can be a complicated task, requiring data, styling, and some technical savvy.
  2. Even if you reuse tiles from an old map, or borrow someone else’s tiles, you sacrifice fine visual control.
  3. Image-based tiles are not well-suited for making things dynamic.
  4. You are usually confined to the standard Web Mercator map projection and zooming behavior.

As a loose rule of thumb, slippy maps are a good choice to the extent that:

  • Browser compatibility and performance are paramount.
  • You need to display a large explorable area at different zoom levels.
  • You don’t need precise visual control over everything.
  • Not all of the map components need to be dynamic or interactive.

How do I make one?

In order to use geodata to make a slippy map, you are really making two maps:

  1. Background tiles – You have to feed a set of data about where land is, where roads are, where points of interest are, etc. into a piece of software and have it generate images based on that. You can skip this step if you are content with an existing set of tiles (see below).
  2. Other content – Once you have tiles, you can use geodata to add things on top like markers or highlighted lines.

One of the best resources for making your own slippy map is Leaflet. This library will do most of the dirty work of a slippy map and let you focus on customizing it. You’ll have to write a little bit of JavaScript, but probably a lot less than you think.

Here is how we might draw Colorado in Leaflet:

map.addLayer(new L.polygon([
    [36.99,-102.04],
    [40.99,-102.04],
    [40.99,-109.05],
    [36.99,-109.05]
]));

Colorado drawn in Leaflet

Leaflet also speaks GeoJSON, so if we had a GeoJSON file with these coordinates we could feed it in directly:

L.geoJson(states).addTo(map);

You can use any tiles you want in Leaflet, including Google Maps.

Tiles

You can generate your own background tiles with TileMill.

Here is a very detailed tutorial on making your own tiles with TileMill:
http://dataforradicals.com/the-insanely-illustrated-guide-to-your-first-tile-mill-map/

You can create custom-styled tiles based on OpenStreetMap data with CloudMade:
http://developers.cloudmade.com/projects/show/tiles

You can also borrow beautiful tiles from Stamen Design:
http://maps.stamen.com/

Or use Google Maps for your base tiles:
https://developers.google.com/maps/

MapBox has a detailed guide on the nuts & bolts of slippy maps:
http://mapbox.com/developers/guide/

Option 2: JavaScript + SVG/Canvas

An example of an SVG map

Another option is to draw a map from scratch right in a web page. This is typically done using either SVG or the HTML5 <canvas> element, which are both methods of creating a drawing space in a webpage and then drawing lots of lines and shapes based on a set of instructions. Unlike maps, which speak lat/lng, these methods speak pixels. The point in the upper-left corner is 0,0. Any other pixel is X,Y where X is the number of pixels to the right of that corner, and Y is the number of pixels below it.

SVG diagram

Under the hood, SVG looks like HTML because it basically is.

<svg width="400" height="200">
    [Your drawing instructions go here]
</svg>

It allows you to draw basic shapes like lines, circles and rectangles, and do other advanced things like gradients and animation. When dealing with maps you’ll be dealing with a lot of <path> elements, which are the standard SVG way of drawing lines, and, by extension, complicated polygons. These can be straight lines, jagged lines, curved lines, line gumbo, deep-fried lines, line stew, you name it. A path gets its instructions on what to draw from one big list of instructions called a data string.

<path d="M200,0 L200,200 Z" /> (Start at 200,0, draw a line to 200,200, and then stop)

The syntax is a little off-putting but it’s not really any different from a polyline generated by lat/lng pairs. It just uses different abbreviations: M for where to start, L for where to draw the next line to, Z to stop. You can use the exact same system to draw geographic things like countries, you just need a lot more points. You might draw Aruba like this:

<path id="Aruba" d="M493.4952430197009,554.3097009349817 L493.6271899111516,554.5053144486982 L493.7591368026024,554.5053144486982 L493.7591368026024,554.6357015002002 L493.8910836940532,554.7660710469861 L493.8910836940532,554.8964231416435 L493.7591368026024,554.8964231416435 L493.6271899111516,554.8964231416435 L493.6271899111516,554.8312492725454 L493.7591368026024,554.8312492725454 L493.7591368026024,554.7660710469861 L493.6271899111516,554.7008884583952 L493.36329612825017,554.5053144486982 L493.23134923679936,554.5053144486982 L493.23134923679936,554.4401143422353 L493.23134923679936,554.3749098398575 L493.23134923679936,554.3097009349817 L493.23134923679936,554.2444876210226 L493.23134923679936,554.1792698913926 L493.23134923679936,554.1140477395024 L493.36329612825017,554.2444876210226 Z" />

You’ll notice that these numbers are way outside the range of a lat/lng. That’s because they aren’t lat/lngs. They are pixel values for a drawing space of a particular size. To go from lat/lng to pixels, you need to use what’s called a map projection, a method for turning lat/lngs into a 2-D drawing. When you make a slippy map, you will generally be automatically using what’s called the Web Mercator projection, but there are lots of others and you’ll need to pick one when making an SVG/Canvas map. This is a bit beyond the scope of this primer, but you can read about the built-in d3 map projections.

SVG/Canvas maps are great because:

  1. You have total visual control. You’re starting with a blank canvas and you can dictate everything about how it looks.
  2. They’re easy to make interactive and dynamic in new and exciting ways. All the pieces of the map are elements on the page just like anything else, so you can style and manipulate them with CSS and JavaScript.
  3. You don’t necessarily need real geodata to make one. If you already have an SVG (like the Wikimedia maps of the world) you can use that instead and skip all the lat/lng business.

SVG/Canvas maps are not great because:

  1. They have browser compatibility issues. IE8 doesn’t support them. (You can add support for IE7 and IE8 with certain libraries)
  2. Because your data is lat/lngs and the output is pixels, you need to deal with map projections to translate it before you draw.
  3. Performance becomes an issue as they get more complex.
  4. Implementing them often requires a reasonably high level of comfort with JavaScript.
  5. Users won’t necessarily know what to do. You will have to quickly teach impatient users how your special new map works to the extent that it deviates from what they’re used to.

How do I make one?

By far the most popular method for dynamically-drawn maps is d3, a fantastic but sometimes mind-bending JavaScript library that is good for many things, of which maps are just one.

There are lots of d3 mapping examples and tutorials, but they probably won’t make sense without a healthy amount of JavaScript under your belt:

http://bost.ocks.org/mike/map/
http://www.schneidy.com/Tutorials/MapsTutorial.html
http://www.d3noob.org/2013/03/a-simple-d3js-map-explained.html

If you want to go easy on the JavaScript, Kartograph.js is also a good option, and as a bonus, it includes support for IE7 and IE8.

Option 3: Let someone else do most of the work

If you have geographic data ready there are a number of services out there that will handle a lot of the actual mapping for you, with varying levels of control over the output:

Google Maps
https://maps.google.com/

Google Earth
http://earth.google.com/

Google Fusion Tables
http://www.google.com/drive/start/apps.html#fusiontables

CartoDB
http://cartodb.com

BatchGeo
http://batchgeo.com/

Flattr this!

SQL: The Prequel (Excel vs. Databases)

- November 7, 2013 in HowTo

Table à encrer les rouleaux d’imprimerie

Image credit: Frédéric Bisson

School of Data is re-publishing Noah Veltman‘s Learning Lunches, a series of tutorials that demystify technical subjects relevant to the data journalism newsroom.

This first Learning Lunch is about the database query language SQL and how it compares to Excel.

What Excel is good at

Excel gets a bad rap. It’s a very flexible, powerful piece of software that’s good at a lot of things.

  • It’s easy to browse data.
  • It’s easy to manually enter and edit data.
  • It’s easy to share copies of files.
  • You have fine control over visual presentation.
  • It has a very flexible structure. Every cell is a unique snowflake.
  • It integrates with other popular office software.
  • Formulas make it a living document.
  • It has a built-in suite of helpers for charts, comments, spellchecking, etc.
  • It’s relatively easy to learn.

What Excel is bad at

Unfortunately Excel also has its limits. It’s pretty bad at some other things.

  • It lacks data integrity. Because every cell is a unique snowflake, things can get very inconsistent. What you see doesn’t necessarily represent the underlying data. A number is not necessarily a number. Data is not necessarily data. Excel tries to make educated guesses about you want, and sometimes it’s wrong.
  • It’s not very good for working with multiple datasets in combination.
  • It’s not very good for answering detailed questions with your data.
  • It doesn’t scale. As the amount of data increases, performance suffers, and the visual interface becomes a liability instead of a benefit. It also has fixed limits on how big a spreadsheet and its cells can be.
  • Collaborating is hard. It’s hard to control versions and have a “master” set of data, especially when many people are working on the same project (Google Spreadsheets fix some of this).

Enter relational databases

What is a relational database? We could get very picky about terminology, but let’s not. Broadly speaking, it consists of a “server” that stores all your data (think of a huge library) and a mechanism for querying it (think of a reference librarian).

The querying is where SQL comes in, emphasis on the Q. SQL stands for Structured Query Language, and it is a syntax for requesting things from the database. It’s the language the reference librarian speaks. More on this later.

The “relational” part is a hint that these databases care about relationships between data. And yes, there are non-relational databases, but let’s keep this simple. We’re all friends here.

The database mantra

Everything in its proper place.

A database encourages you to store things logically. Sometimes it forces you to.

Every database consists of tables. Think of a table like a single worksheet in an Excel file, except with more ground rules. A database table consists of columns and rows.

Columns

Every column is given a name (like ‘Address’) and a defined column type (like ‘Integer,’ ‘Date’, ‘Date+Time’, or ‘Text’). You have to pick a column type, and it stays the same for every row. The database will coerce all the data you put in to that type. This sounds annoying but is very helpful. If you try to put the wrong kind of data in a column, it will get upset. This tells you that there’s a problem with your data, your understanding of the data, or both. Excel would just let you continue being wrong until it comes back to bite you.

You can also specify helpful things like…
… whether a column can have duplicate values.
… whether a column can be empty.
… the default value for a column if you don’t specify one.

Columns define the structure of your data.

Rows

Rows are the actual data in the table. Once you establish the column structure, you can add in as many rows as you like.

Every row has a value for every column. Excel is a visual canvas and will allow you to create any intricate quilt of irregular and merged cells you’d like. You can make Tetris shapes and put a legend in the corner and footnotes at the bottom, all sharing the same cells.

This won’t fly with a database. A database table expects an actual grid. It’s OK for cells to be empty, but to a computer intentionally empty is not the same as nonexistent.

Multiple tables, joins, and keys

More on this later, but part of putting everything in its proper place means making it easy to break up your data into several tables for different data categories and work with them as a set.

Let data be data.

A database focuses only on the data layer of things and ignores visual presentation. Colors, fonts, borders, date formatting, and number formatting basically don’t exist. What you see is mostly what you get. That’s good news and bad news: it means that a database is usually really good at what it does do, but it also often needs to be paired with other things in order to create a final product, like a chart or a web page. A database is designed to plug in to other things. This extra step is one of the things that turns a lot of people off to databases.

By being really good at data storage and processing and not at other things, databases are extremely scaleable. 1 million rows of data? 10 million? No problem. For newsroom purposes, there’s virtually no upper limit to how much data you can store or how complicated you can make your queries.

Databases & the web

Databases are great for preliminary analysis, exploration, and data cleaning. But they’re even better for connecting to something else once you know what you want to do with the data. Virtually every web application is powered by databases like this. When you log in somewhere, it’s checking your username and password against a database. When you go to IMDB and click on a movie, it’s looking up a database. Twitter, Facebook, Gmail, it’s databases all the way down.

When it comes to news features, a database usually gets involved when the amount of data is large or it is expected to change over time. Rather than having a static JSON file with your data, you keep a database and you write an app that queries the database for the current data. Then, when the data changes, all you have to do is update the database and the changes will be reflected in the app. For one-off apps where the data is not going to change and the amount is small, a database is usually overkill, although you may still use one in the early stages to generate a data file of some sort.

If you’re using an API to feed current data into an app instead, you’re still using a database, you’re just letting someone else host it for you. This is much easier, but also poses risks because you access the data at their pleasure.

Potential semantic quibble: sometimes an app isn’t directly accessing a database to fetch information. Sometimes it’s accessing cached files instead, but those cached files are generated automatically based on what’s in the database. Tomato, Tomahto.

So when should I use a database instead of Excel?

Excel and databases are good for very different things. Neither is per se good or bad. A rule of thumb: you should strongly consider using a database for a project to the extent that the following are true:

  • You have a lot of data.
  • Your data is messy or complex.
  • You want to power something else with your data.
  • Other people need to work with the same data.

OK, I’m intrigued. How do I get started?

Because databases have a learning curve, it makes sense not to dive in too deep right away. Start off using it only in cases where the advantage is especially strong and your needs are pretty simple. As your comfort level increases, you’ll increasingly look towards databases to get what you want faster.

Option 1: SQLite

SQLite is a good way to get started. You can install the “SQLite Manager” add-on for Firefox and do everything within the browser.

A SQL tutorial based on SQLite: https://github.com/tthibo/SQL-Tutorial

Option 2: Microsoft Access

Microsoft Access runs on SQL and presents a more traditional desktop software interface. Depending on who you ask, it’s either a helpful tool or just makes things more confusing. I wouldn’t personally recommend it, but your mileage may vary.

Option 3: Set up a shared web hosting account

You can set up a shared web hosting account as a sandbox to play with this. This can cost as little as £20 a year. These accounts typically come with an interface to let you create, edit, and interact with databases without writing any SQL. They also give you a place to play around with any other web-related skills you’re interested in and share the results with others!

A Small Orange (a good, cheap hosting option): http://asmallorange.com/

Option 4: Install MySQL or PostgreSQL on your computer

You can install MAMP on a Mac or WAMP on a Windows PC. This will install MySQL as well as a great web-based interface called phpMyAdmin (http://www.phpmyadmin.net). Once you have MySQL installed, you have lots of additional options for free software to serve as a browser/editor for your SQL databases. If you prefer you can install PostgreSQL instead, a slightly different database flavor (there are many different flavors of database but MySQL and PostgreSQL are two popular ones with lots of documentation, don’t overthink it for now).


Appendix: querying for fun and profit

Much of the power of relational databases comes from SQL, a very flexible language for asking a database questions or giving it orders. The learning curve is steeper than Excel, but once you get the hang of it you can quickly answer almost any question about your data. Let’s go through some brief examples of how a desired action looks in SQL.

The basic building blocks of SQL are four verbs: SELECT (look up something), UPDATE (change some existing rows), INSERT (add some new rows), DELETE (delete some rows). There are many other verbs but you will use these the most, especially SELECT.

Let’s imagine a table called athletes of Olympic athletes with six columns:

name
country
birthdate
height
weight
gender

When creating our table, we might also specify things like “country can be empty” or “gender must be either M or F.”

Query 1: Get a list of all the athletes in alphabetical order. This will show you the entire table, sorted by name from A-Z.

SELECT
*
FROM athletes
ORDER BY name ASC

Query 2: Get a list of all the athletes on Team GB. This will show you only the rows for British athletes. You didn’t specify how to sort it, so you can’t count on it coming back in the order you want.

SELECT
*
FROM athletes
WHERE country = 'Great Britain'

Query 3: What country is the heaviest on average? This will take all the rows and put them into groups by country. It will show you a list of country names and the average weight for each group.

SELECT
country,AVG(WEIGHT)
FROM athletes
GROUP BY country

Query 4: What birth month produces the most Olympic athletes? Maybe you want to test an astrological theory about Leos being great athletes. This will show you how many Olympic athletes were born in each month.

SELECT
MONTHNAME(birthdate),COUNT(*)
FROM athletes
GROUP BY MONTHNAME(birthdate)

Query 5: Add a new athlete to the table. To insert a row, you specify the columns you’re adding (because you don’t necessarily need to add all of them every time), and the value for each.

INSERT
INTO athletes
(name,country,height,weight,gender)
VALUES ('Andrew Leimdorfer','Great Britain',180,74.8,'M')

Query 6: Get all male athletes in order of height:weight ratio. Maybe you would notice something strange about Canadian sprinter Ian Warner.

SELECT
*
FROM athletes
WHERE gender = 'M'
ORDER BY height/weight ASC

Query 7: If you got your data from london2012.com, you would think 5′ 7″ Ian Warner was 160 kg, because his weight was probably entered in lbs instead. Let’s fix that by UPDATEing his row.

UPDATE
athletes
SET weight = weight/2.2
WHERE NAME = 'Ian Warner'

Query 8: Delete all the American and Canadian athletes, those jerks.

DELETE
FROM athletes
WHERE country = 'United States of America' OR country = 'Canada';

Once you look at enough queries you’ll see that a query is like a sentence with a grammar. It has a “verb” (what kind of action do I want?), an “object” (what tables do I want to do the action to?), and optional “adverbs” (how specifically do I want to do the action?). The “adverbs” include details like “sort by this column” and “only do this for certain rows.”

Bonus Level: multiple tables and a brief taste of JOINs

You probably have a lot more data than just athletes. For each country, you might also have its flag, its population, and its capital city. You also have all the Olympic events, which athletes participated in them, which venues they were at, which sport category they belong to. For each event, you also end up with results: who got which medals, and in some cases what the finishing times/scores were.

The typical Excel approach to this is one of two forms of madness: either you have a bunch of spreadsheets and painstakingly cross-reference them, or you have one mega-spreadsheet with every column (government data sources love mega-spreadsheets).

You might have a spreadsheet where each row is an athlete, and then you have a long list of columns including lots of redundant and awkwardly-stored information, like:

name, country, birthdate, height, weight, gender, country_population, country_flag_url, country_gdp, event1, event1_date, event1_result, event2_date, event2_result, event3_date, event3_result, event4_date, event4_result, number_of_medals

This mega-spreadsheet approach has all kinds of weaknesses:

  • You lose the benefit of visually browsing the information once a table gets this big. It’s a mess.
  • This structure is very inflexible. The law of mega-spreadsheets states that once you arbitrarily define n columns as the maximum number of instances a row could need, something will need n+1.
  • It has no sense of relationships. Athletes are one atomic unit here, but there are others. You have countries, you have events (which belong to sports), you have results (which belong to events), you have athletes (which compete in events, have results in those events, and almost always belong to countries). These relationships will probably be the basis for lots of interesting stories in your data, and the mega-spreadsheet does a poor job of accounting for them.
  • Analysis is difficult. How do you find all the athletes in the men’s 100m dash? Some of them might have their time in event1_result, some of them might have it in event2_result. Have fun with those nested IF() statements! And if any of this data is manually entered, there’s a good chance you’ll get textual inconsistencies between things like “Men’s 100m,” “Men’s 100 meter,” and “100m.”

SQL lets you keep these things in a bunch of separate tables but use logical connections between them to smoothly treat them as one big set of data. To combine tables like this, you use what are called JOINs. In a single sentence: a JOIN takes two tables and overlaps them to connect rows from each table into a single row. JOINs are beyond the scope of this primer, but they are one of the things that make databases great, so a brief example is in order.

You might create a table for athletes with basic info like height & weight, a table for events with details about where and when it takes place and the current world record, a table for countries with information about each country, and a table for results where each row contains an athlete, an event, their result, and what medal they earned (if any). Then you use joins to temporarily combine multiple tables in a query.

Who won gold medals today?

SELECT
athletes.name, athletes.country, event.name
FROM athletes, results, events
WHERE athletes.id = results.athlete_id AND event.id = results.event_id
AND event.date = DATE(NOW()) AND results.medal = 'Gold'

How many medals does each country have?

SELECT
countries.name, COUNT(*)
FROM athletes, countries, results, events
WHERE athletes.id = results.athlete_id AND event.id = results.event_id AND athletes.country_id = countries.id
AND results.medal IN ('Gold','Silver','Bronze')
GROUP BY countries.id

Flattr this!