You are browsing the archive for Research.

Data is a Team Sport

- December 20, 2017 in Announcement, Data Blog, Research

Data is a Team Sport is a series of online conversations held with data literacy practitioners in mid-2017 that explores the ever evolving data literacy eco-system. Our aim in producing ‘Data is a Team Sport’ was to surface learnings and present them in formats that would be accessible to data literacy practitioners.

Thanks to the efforts of governments, organizations and agencies to make their information more transparent the amount of data entering the public domain has increased dramatically in recent years. As political and economic forces become more adept at using data, we enter a new era of data literacy were just being able to understand information is not enough. In this project, we aimed to engage data literacy practitioners to capture lessons learned and examine how their methodologies are shifting and adapting. We also wanted to better understand how they perceived the data literacy ecosystem: the diverse set of actors needed to enable and support the use of data in social change work.

Conversation Guests PodCast
Enabling Learning Rahul Bhargava & Lucy Chambers [soundcloud url=”https://api.soundcloud.com/tracks/326264327″ params=”color=#ff5500&inverse=false&auto_play=false&show_user=false” width=”100%” height=”20″ iframe=”true” /]
Data Driven Journalism Eva Constantaras & Natalia Mazotte [soundcloud url=”https://api.soundcloud.com/tracks/328987340″ params=”color=#ff5500&inverse=false&auto_play=false&show_user=false” width=”100%” height=”20″ iframe=”true” /]
One on One with Daniela Lepiz Daniela Lepiz [soundcloud url=”https://api.soundcloud.com/tracks/331054739″ params=”color=#ff5500&inverse=false&auto_play=false&show_user=false” width=”100%” height=”20″ iframe=”true” /]
Advocacy Organisations Milena Marin & Sam Leon [soundcloud url=”https://api.soundcloud.com/tracks/332772865″ params=”color=#ff5500&inverse=false&auto_play=false&show_user=false” width=”100%” height=”20″ iframe=”true” /]
One on One with Heather Leson Heather Leson [soundcloud url=”https://api.soundcloud.com/tracks/333725312″ params=”color=#ff5500&inverse=false&auto_play=false&show_user=false” width=”100%” height=”20″ iframe=”true” /]
One on One with Friedhelm Weinberg Friedhelm Weinberg [soundcloud url=”https://api.soundcloud.com/tracks/335294348″ params=”color=#ff5500&inverse=false&auto_play=false&show_user=false” width=”100%” height=”20″ iframe=”true” /]
Mentors, Mediators and Mad Skills Emma Prest & Tin Geber [soundcloud url=”https://api.soundcloud.com/tracks/336474972″ params=”color=#ff5500&inverse=false&auto_play=false&show_user=false” width=”100%” height=”20″ iframe=”true” /]
Government Priorities and Incentives Ania Calderon & Tamara Puhovski [soundcloud url=”https://api.soundcloud.com/tracks/337462183″ params=”color=#ff5500&inverse=false&auto_play=false&show_user=false” width=”100%” height=”20″ iframe=”true” /]

Read the rest of this entry →

Flattr this!

Rethinking data literacy: how useful is your 2-day training?

- July 14, 2017 in Research

As of July 2017, School of Data’s network includes 14 organisations around the world which collectively participate to organise hundreds of data literacy events every year. The success of this network-based strategy did not come naturally: we had to rethink and move away from our MOOC-like strategy in 2013 in order to be more relevant to the journalists and civil society organisations we intend to reach.

In 2016 we did the same for our actual events.

The downside of short-term events

Prominent civic tech members have long complained about the ineffectiveness of hackathons to build long-lasting solutions for the problems they intended to tackle. Yet various reasons have kept the hackathon popular: it’s short-term, can produce decent-looking prototypes, and is well-known even beyond civic tech circles.

The above stays true for the data literacy movement and its most common short-term events: meetups, data and drinks, one-day trainings, two-day workshops… they’re easy to run, fund and promote: what’s not to love?

Well, we’ve never really been satisfied with the outcomes we saw of these events, especially for our flagship programme, the Fellowship, which we monitor very closely and aim to improve every year. Following several rounds of surveys and interviews with members of the School of Data network, we were able to pinpoint the issue: our expectations and the actual value of these events are mismatched, leading us not to take critical actions that would multiply the value of these events.

The Data Literacy Activity Matrix

To clarify our findings, we put the most common interventions (not all of them are events, strictly speaking) in a matrix, highlighting our key finding that duration is a crucial variable. And this makes sense for several reasons:

  • Fewer people can participate in a longer event, but those who can are generally more committed to the event’s goals

  • Longer events have much more time to develop their content and explore the nuances of it

  • Especially in the field of data literacy, which is focused on capacity building, time and repetition are key to positive outcomes

Data Literacy Activity Matrix

(the categories used to group event formats are based on our current thinking of what makes a data literacy leader: it underpins the design of our Fellowship programme.)

Useful for what?

The matrix allowed us to think critically about the added value of each subcategory of intervention. What is the effective impact of an organisation doing mostly short-term training events compared to another one focusing on long-term content creation? Drawing again from the interviews we’ve done and some analysis of the rare post-intervention surveys and reports we could access (another weakness of the field), we came to the following conclusions:

  • very short-term and short-term activities are mostly valuable for awareness-raising and community-building.

  • real skill-building happens through medium to long-term interventions

  • content creation is best focused on supporting skill-building interventions and data-driven projects (rather than hoping that people come to your content and learn by themselves)

  • data-driven projects (run in collaboration with your beneficiaries) are the ones creating the clearest impact (but not necessarily the longest lasting).

Data Literacy Matrix - Value Added

It is important, though, not to set short-term and long-term interventions in opposition. Not only can the difference be fuzzy (a long term intervention can be a series of regular, linked, short term events, for example) but both play roles of critical importance: who is going to apply to a data training if people are not aware of the importance of data? Conversely, recognising the specific added value of each intervention requires also to act in consequence: we advise against organising short-term events without establishing a community engagement strategy to sustain the event’s momentum.

In hindsight, all of the above may sound obvious. But it mostly is relevant from the perspective of the beneficiary. Coming from the point of the view of the organisation running a data literacy programme, the benefit/cost is defined differently.

For example, short-term interventions are a great way to find one’s audience, get new trainers to find their voice, and generate press cheaply. Meanwhile, long-term interventions are costly and their outcomes are harder to measure: is it really worth it to focus on training only 10 people for several months, when the same financial investment can bring hundreds of people to one-day workshops? Even when the organisation can see the benefits, their funders may not. In a field where sustainability is still a complicated issue many organisations face, long-term actions are not a priority.

Next steps

School of Data has taken steps to apply these learnings to its programmes.

  • The Curriculum programme, which initially focused on the production and maintenance of online content available on our website has been expanded to include offline trainings during our annual event, the Summer Camp, and online skillshares throughout the year;

  • Our recommendations to members regarding their interventions systematically refer to the data literacy matrix in order for them to understand the added value of their work;

  • Our Data Expert programme has been designed to include both data-driven project work and medium-term training of beneficiaries, differentiating it further from straightforward consultancy work.

We have also identified three directions in which we can research this topic further:

  • Mapping existing interventions: the number, variety and quality of data literacy interventions is increasing every year, but so far no effort has been made to map them, in order to identify the strengths and gaps of the field.

  • Investigating individual subgroups: the matrix is a good starting point for interrogating best practices and concrete outcomes in each of the subgroups, in order to provide more granular recommendations to the actors of the field and the designing of new intervention models.

  • Exploring thematic relevance: the audience, goals and constraints of, say, data journalism interventions, differ substantially from those of the interventions undertaken within the extractives data community. Further research would be useful to see how they differ to develop topic-relevant recommendations.

Flattr this!

Data Journalism in Turkey: still a new topic

- July 27, 2016 in Event report, Research

School of Data now counts among its ranks a local group in Turkey led by Pınar Dağ, an experience Data Journalist and Journalism professor based in Istanbul. As part of their activities, they have been running numerous datajournalism trainings, attracting an important proportion of non-journalists, eager to learn about data. The article below presents a data-driven overview of these workshops.


According to the participation research of data journalism workshops carried out with all 110 participants hosted by Pınar Dağ and Sadettin Demirel, 36.4% of all participants stated that they have studied data literacy courses before the workshops, while the remaining 70 people make up the 63% that have never before studied data literacy or data analysis.


If we analyse the data obtained in the context of gender and age, there are 21 men and 17 women that expressed they have training experience regarding data analysis. However, the interesting figure comes from the younger generation. 65% of participants are between 18 and 25 ages, and they have no experience or previous training in data literacy.


These numbers indicated that even though the participants met with data analysis and data literacy by way of data journalism workshops, the participants from the 18-25 age range have a serious lack of data literacy.


The workshops contribute to spreading data journalism terminologies


Data journalism has its own terminology and vocabulary, so in order to evaluate how participants learn the main names such as data journalism, open data, open government, data portal, data visualization, we asked them whether they ascertained these terminologies thought the workshops, or from elsewhere.


More than half of the participants pointed out that they had known previously the data journalism and open data terms. On the other hand, 36 people expressed that they understand data journalism thanks to the workshops, where as 41 participants said the same for open data.


Also, a number of participants stated they know open government, data portal and data visualization terminologies by way of data journalism training. This was more than other participants that indicated they already knew. If we describe the issue with numbers, 70 of 110 participants learned about data portals with the workshops, while 53 of them for open government, and 51 of them for data visualisation stated that they have known these terms through the help of workshops.


The good news is that the number of participants in the 18 – 25 age range that learn data journalism terms thanks to the workshops, is more than twice of those who knew the terminologies previously. As a result, these statistics underline that workshops facilitate the understanding of terminology.


90 percent of participants like the data journalism workshops


99 people (90 %) of participants expressed that they liked the data journalism training. Seven people stayed indecisive and four of them said they didn’t like it. The participants appreciated not only workshops but also the instructors and contents of training and the other guests.


As the data indicated, 87.1 % of people were very pleased by the content of the workshop while 102 participants said they liked the guests. 94 of them said they appreciated the data journalism instructors. Most of participants had a positive attitude on content, instructors, and guests of workshops. There were also participants that remained indecisive, or did not appreciate some features of the data journalism training.


52.8 % of participants did not like the duration of the workshops


While 27.2% of participants, a total of 30 participants, expressed that they liked the duration and time of the workshops, 28 people, 25.4%, stayed indecisive. So 52.8% of participants, the remaining 58 people, were not pleased with the length of the workshops.


On the other hand, there was a negative perception about the infrastructure and internet network among the participants. 54.1 percentage of participants pointed out that they didn’t appreciate the internet network that was provided for data journalism activities.


Moreover, most of the participants were fine with accommodation (65.4%), transportation (74.1%) and catering services (66.3%) that were supplied during the workshops.


More than half of the participants heard about workshops via social media


The question was ‘how did you find out about workshops and where do you get workshop news and announcements?’ The participants stated that they find out and get in touch with workshops predominantly via social media (54%), instructors at universities (26.3%), e-mail (30%), website (35.4%), and friends (17.7%)


    It seems especially digital communication channels which are social media and e- mail played an important role to get in touch with participants and get them informed.  

53 percent of Participants stated: I can make data visualizations


More than half of the participants said that they can create data visualizations thanks to the workshops while 51% of them, a total of 57 participants, expressed that workshops informed and facilitated them to get involved with various kinds of data sources. Also, 41% of participants stated they have developed their data analysis skills and 40% of them underlined they can work with data thanks to the help of the workshops.


All we need is longer workshops


The last two question of the research are about participants suggest what to improve data journalism workshops and increase and spread data literacy.


87% of the participants, a total of 86 people, suggested that they need long-dated workshops that are based on generation of data journalism projects. This is the most supported advice among the other options. Other options were cooperation with journalism association, inviting international data journalists for workshops and arranging MOOC programs to increase efficiency and get in touch with more people.


    The university curriculums need data literacy courses  

In order to increase data literacy, 74.5% of participants indicated that the university curriculum needs more data literacy and data journalism courses. The participants suggest that these courses could add to the current education plans. Also 60.9% of them think the key is open data. If government increases sharing more sources of open data, that could improve data literacy in Turkey.


There are other suggestions too. For example, cooperation with journalists, NGOs and developers, to fund support of the government to create a data savvy generation.


Last but not least, we asked all the participants, ‘If you had the chance, would you want to attend more workshops?’ 103 of 110 participants said yes, they would.


Methodology

Quantitative method is used along with survey data gathering techniques for this research. Participants are reached via e-mail and Google form is used as a tool of the questionnaire. The population of this research is the participants of the last 10 data journalism workshops. Because of the fact that a number of participants have changed between 10 and 20 for per workshop, the exact number of participants has taken 15 for per workshops. So the research universe is 150 people. The sample size of research is calculated with 95% confidence level and a 5 % margin of error. The sample size is accepted as 109 participants.


Tableau, Infogr.am and Google Charts used for data visualisations

Research datasets: https://drive.google.com/open?id=0Bxz1Zy_R9wbONEMxWWJucHAwVlE

Research questionnaire : https://drive.google.com/open?id=0Bxz1Zy_R9wbOek14Y09QQUk2NjA


Flattr this!

Research Results Part 5: Improving Data Literacy Efforts

- February 5, 2016 in Research

As technologies advance and the accessibility of data becomes ubiquitous, data literacy skills will likely gain increasing importance. The School of Data training resources have already laid an important foundation for social change efforts to harness data and improve their impact. Going forward, School of Data local communities will have to take into account their role as stewards of the curriculum, and continue to develop and incorporate new learnings as access to data continues to increase.

From what we (Mariel Garcia, and myself) have learned by conducting this research, we make the following recommendations:

  • Training the trainers: The School of Data curriculum is the foundation for much of the Data Literacy training that is happening both inside and outside the School of Data network, as reported by interviewees; it would make sense to focus efforts on preparing materials not just for learner consumption, but also in a curriculum format for trainers.
  • More research on pedagogical methods: Additional research and establishment of effective pedagogical methods of data literacy training would be beneficial – many interviewees mentioned the importance of this topic, and yet had no resources to share about it. In this regard, Peer to Peer University is the one participant that has invested most resources into this understanding, and is a great ally going forward in this area.
  • More knowledge-sharing within the network: In this regard, the School of Data network also functions as a ‘community of practice’ for trainers who are sharing advice and tips on providing data literacy training, but this could be strengthened by actively promoting conversations around the topics covered in this research.
  • Measuring the impact: As with different initiatives, impact evaluation is an area in which data literacy work can still grow. Both the School of Data local communities and data literacy related organisations need much stronger articulations of their long-term goals and intended impact in the short term.  School of Data events might be a good space to have the necessary conversations to find frameworks of evaluation that work for different work formats and budgets. Some organizations outside of the School of Data network (IREX and Internews) have worked extensively on this, and could be good references going forward.
  • Promoting long term engagements: It appeared during the research that only older and established organisations had started long term projects and engagements related to data literacy. Consequently, it might make sense for School of Data to help smaller and newer organisations within its community to start and sustain long term engagements, by helping them find the necessary resources. This could provide an important focal point for collaborations within the network as it will likely yield important learnings.
  • Data literacy at the organisation level: Articulate how individual data literacy training can complement and support long term engagements that will lead to organisational data literacy. Building local fellowship programs that can engage social change organisations over the long-term and build their capacity to utilise data in their campaigns will likely lead to deeper alliances and joint funding opportunities.
  • Better collaboration with outside partners: The project would stand to benefit from more linkages and collaborations with academia, open data-related civil society efforts. Additionally, more efforts can be made to improve the accessibility of the School of Data curriculum, methodologies and trainings. This will likely lead to more diverse and sustainable funding.

The goal of this research was to empower the School of Data Steering Committee to take strategic decisions about the programme going forward along with helping the School of Data network members build on the successes to date. We hope that in providing this research and recommendations in an accessible format, both School of data and the wider network of data literacy practicioners will benefit from it. Hopefully, these research results will complement and contribute to the School of Data’s goal of improving the impact of social change efforts through data literacy.

In our next and final blog post, we will present a list of resources and references we used during our research.

Flattr this!

Research Results Part 4: Which Business Models for Data Literacy Efforts?

- January 29, 2016 in Research

After researching the definitions of data literacy, along with the methodologies and impact of data literacy efforts, we looked into the question of business models: are there sustainable business models that can support data literacy efforts in the long term? Along with looking at how data literacy efforts can support themselves financially, we also looked for opportunities for linkages with other efforts.

No clear business model for sustainability

Many of the School of Data local communities and external organisations that provide data literacy training are using a mix of foundational funding and fee for service to sustain themselves. The organisations using this model are opportunistic in getting organisations and individuals to pay for trainings when they can, but a lack of understanding about data processes among clients is often a problem. At this point, there is not a clear ‘sustainable business model’ that would direct data literacy organisations towards longevity. To understand better the business models of established organisations working at the intersection of technology and social change, we looked at a two of them: Aspiration and Tactical Technology Collective. 

Aspiration

Aspiration is a US-based NGO that operates globally, providing a range of services to build capacity and community around technology for social change. Over the last decade, under Allen Gunn’s (Gunner) leadership, Aspiration has gained a strong reputation for delivering trainings and events that focus on strategic and tangible outcomes while strengthening communities of practice.  Aspiration has championed an approach known as participatory events, developing knowledge-sharing and leadership development methodologies that prioritize active dialog-based learning. The philosophy and design focus on maximizing interaction and peer learning while making spare use of one-to-many and several-to-many session formats such as presentations and panels. Aspiration has been able to scale their model across a range of meeting sizes and purposes, from smaller team strategy sessions and retreats to large-scale events, such as the Mozilla Festival, which brings together over 1,500 participants.

Aspiration’s services are in high demand, with clients ranging from both small civil society organisations to larger international NGO’s and foundations. They have seen a gradual reduction in reliance on grants, and now generate the majority of their funds through earned income from strategic consulting services, events, and trainings. In order to scale service delivery, program staff have all been trained in the unique skill sets required for delivering participatory events and providing strategic services within the Aspiration frame of analysis. The organization now has five full-time staff able to deliver both live events and strategic services.

Tactical Technology Collective

Fee for service work on utilising data in social change has had an increased market in the civil society sector over the last five to seven years. However, many social change organisations have been unaware of the amount of resources and effort it takes to analyse and produce outputs such as data visualisations and info-graphics. A more mature organisation with experience in utilising information and technologies in activism, Tactical Technology Collective, set up a social enterprise, Tactical Studios, to undertake data-driven projects for large-scale NGO’s. They attempted to better educate clients by engaging them in creation of design briefs and a more intentional process. Tactical Studios was marginally successful as most advocacy and activist connected organisations look for quick and low-cost solutions to their data visualisations. 

Using collaborations and linkages to improve the understanding of data needs

A hopeful example in developing the capacity of organisations to understand the amount of resources needed to utilise data is in the School of Data’s Embedded Fellowship with Global Witness. Through a six-month engagement, the fellow, Sam Leon, was able to provide data trainings at all levels of the organisation – from senior management to the front line staff. This has helped the organisation, rather than just the individuals, to improve its data literacy.  What this points to is a need to differentiate between individual data literacy and organisational data literacy. While the School of Data curriculum addresses individual data literacy, efforts like the fellowship programme, that have long term engagements succeed in building organisational capacities. Being more intentional in articulating both the difference and how they complement each other will likely lead to a greater ability to raise funds and develop deeper relationships with allies.

Other potential areas for linkages and collaboration on the School of Data Curriculum that could lead to greater sustainablity for data literacy organisations:

    • Schools and universities who are interested in expanding their course offerings to better address data literacy amongst students. An opportunity for chapters is to work with local academia in adapting the School of Data curriculum to address the needs of students who will potentially be using open-data in their careers. Teachers are also in need of training on the pedagogy in regards to understanding data and it’s contexts, as opposed to understanding how to use tools. Academic grants and funding could support this adaptation.
    • Civil society efforts that are working towards the release of data, particularly by governments, for use in the public domain. One area that has a strong need for greater data literacy is the open governments, transparency and accountability movements, whose area of expertise is in pressuring governments through advocacy campaigns to release data. Many do not have capacity to provide training to those who might actually use the data. In this regard, a conclusion of the International Open Data Conference in 2015 (as stated in its final report) poses the need for work to identify and embed core competencies for working with open data within existing organizational training, formal education, and informal learning programs.
    • Development initiatives, particularly those that are focused on supporting an emerging private sector that will be inspired by data for use in innovation.  Access and use-ability of open data could be exploited by the private sector in ways that could expand data literacy in emerging economies.  Current development initiatives could greatly benefit from engaging with School of Data chapters and engaging with the curriculum.

In order to sustain a long term data literacy initiative, it is likely that funding will need to come from a mix of foundational funding and fee for service work through expanding the diversity of clients, collaborations and linkages. As open-data usability and access continues to improve, it will be critical that Data Literacy organisations stay on top of future trends and continue to shape their curriculum to meet the needs of the communities they aim to serve. Hopefully, funders and social change organisations will also continue to evolve in their understanding of the importance of data and the resources involved in making it useful to stakeholders. As a network, the School of Data local communities will need to share information about how they grow and evolve sustainable business models.

In our next blog post ‘Recommendations for Improving Data Literacy Efforts’ we will discuss the conclusions that we have made as a result of undertaking this research effort.

Flattr this!

Research Results Part 3: Measuring the Impact of Data Literacy Efforts

- January 21, 2016 in Research

As there are a wide range of methodologies for achieving data literacy in social change efforts, there is also a range of approaches to determining effectiveness. The degree to which a data literacy practice has the capacity to measure effectiveness is largely based on that practice’s maturity level. Participants who work for older, established organizations reported devoting considerable resources to M&E, whereas most individuals and participants from smaller organizations recognized that they were very limited in their evaluation possibilities. Methodologies for evaluating efficacy of data literacy efforts are not standardised. To measure the impact of data literacy work in environments with limited resources, participants in our research focus on the following sources of information:

  • Analysis of data outputs: some of the participants mentioned the relative ease to measure the impact of data work (as compared to other ICT-related initiatives) because there will be outputs that you can analyze qualitatively.
  • Sentiment analysis: Data literacy trainers frequently mentioned the importance of measuring outcomes by trying to get a feel for the reactions of people before ending a workshop, particularly in processes where follow-up is unlikely.
  • Having an eye for the manifestation of organizational (vs individual) change: For some trainers, the true impact of data literacy work can be seen in how data work becomes internalised in an organization’s programmes and staffing.
  • Direct skills assessment: Perhaps difficult to evaluate without exams, some participants rely on self-reporting from their beneficiaries and try to compare pre and post surveys to see the impact of particular training processes.

Diversity in approach

More recently established data literacy efforts are using basic evaluation forms distributed at the end of their trainings. Data literacy trainers frequently mentioned the importance of measuring outcomes by trying to get a feel for the reactions of people in their workshops. This involves including questions about the setup and fulfilment of expectations in post-workshop surveys, but also looking for signs of independent work and pondered questions. A few of the participants consider these signs of engagement are crucial in processes where follow up isn’t likely.

Code for Africa has developed a robust set of success indicators that allow them to chart a path towards success such as data responsibilities being included in organisational job descriptions. For some practitioners, the true impact of data literacy work can be seen in organizational change. Will someone be hired to do data work in the organizations? Do senior executives value data work more and are they willing to allocate more funds for this type of work?

Some of the participants mentioned the relative ease to measure the impact of data work (as compared to other ICT-related initiatives) because there will be outputs that you can analyze qualitatively. A couple of organizations mentioned detailed analysis frameworks to measure the quality of stories in data journalism, for example – employing local data journalists who could evaluate stories from before and after the processes took place to compare the performance of beneficiaries.

Some participants rely on self-reporting from their beneficiaries (through surveys that ask questions on their level of comfort/knowledge on specific skills) – and try to compare pre and post surveys to see the impact of particular training processes.

Even though most participants had given thought to monitoring and evaluation in a way or another, few of them had developed frameworks to use before, during and after the implementation of a project or program. Many of these efforts need more opportunity to articulate what success would look like for their project, and then work backwards to understand what steps and endeavours they need to accomplish to attain that success.

Determining effective ways to measure impact

During a workshop on impact assessment provided to data literacy practitioners connected to the School of Data network in March of 2015, it was determined that the term ‘impact assessment’ may not be an appropriate term, as it implies more robust and resource intensive endeavours that is often applied when evaluating public policy. There was a strong desire for lightweight methodologies that will help them learn how to improve offerings that will deliver greater impact in the long term. They determined that the methodology should contain some basic elements, such as baselines, working with beneficiaries to establish indicators, having feedback loops, articulating clear and transparent goals, having consistency throughout their programs and taking the time to document.

While some exchange between data literacy practitioners has begun around methodologies for evaluation that leads to learning and improved projects, there needs to be continued dialogue in the School of Data network to determine effective ways of measuring impact.

In our next post, ‘Sustainable Business Models for Data Literacy Efforts’, we will explore viable models and opportunities for data literacy practitioners to fund and support their work.


Flattr this!

Research Results Part 2: The Methodologies of Data Literacy

- January 14, 2016 in Research

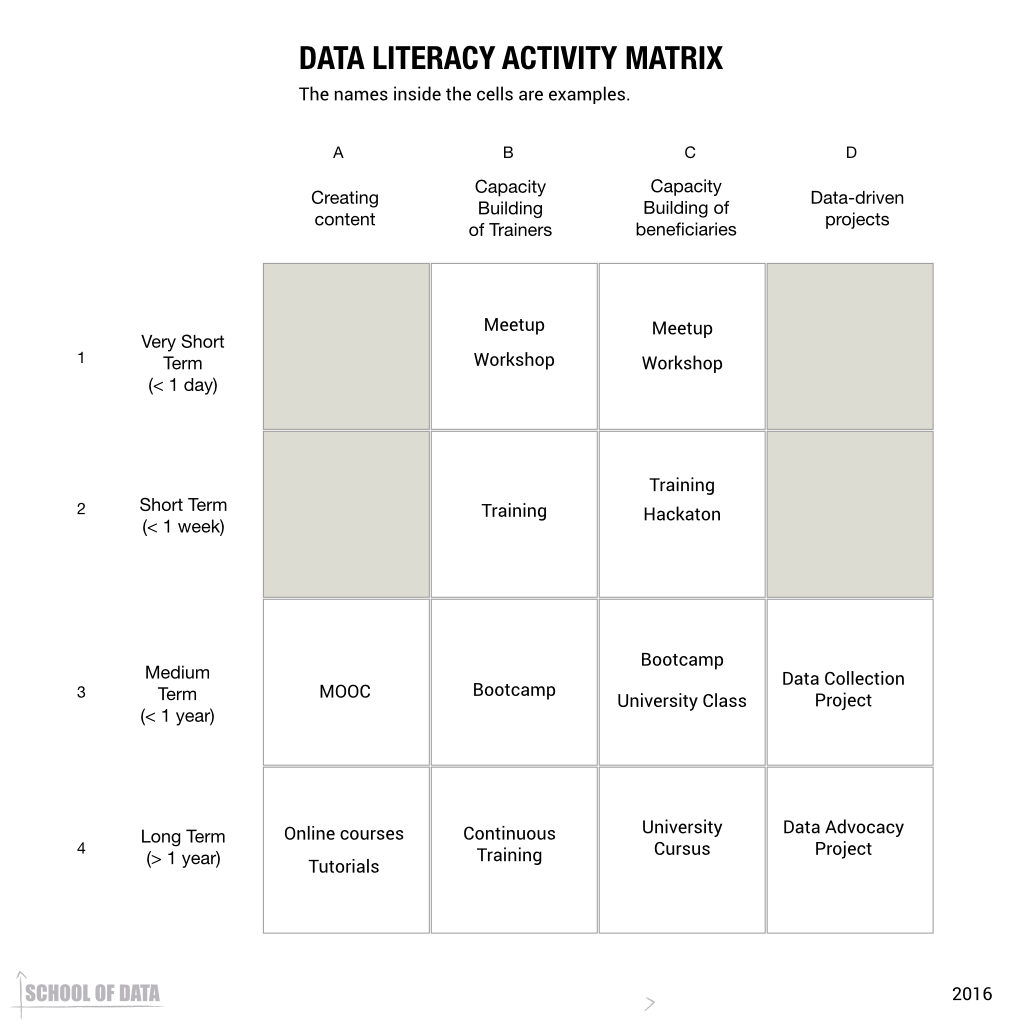
After exploring how to define data literacy, we wondered about the reality of the work of data literacy advocates. Which methodology do they use and what does it look like in practice? Unsurprisingly, there is a wide range of methodologies in use across different groups. Each of them fits the available opportunities, time and resources.

Short term efforts

Workshops

A large part of the training done by the data literacy advocates surveyed take the form of workshops. Participants agreed that workshops (rather than talks) were a good way to promote practical learning, and also the short timeframe allowed for the participation of individuals and organizations with resource constraints. Some workshops can be delivered inside of conferences and events (ranging from two hours to a half-day), and their learning goals are largely limited to introducing the basic topics to participants. Some of those workshops can be multi-day, ranging from two to five days: they allow for a longer exposure to processes and provide enough of a foundation to start concrete data projects. Multi-day workshops may also be augmented with follow-up sessions designed to provide guidance and support during the life of a data project.

The following short term workshops were mentioned:

  • 2 hour workshops: they are the ones that take place in conferences, and which only provide space for an introduction (but require few resources to make happen)
  • Half day workshops: they are seen as good for introductions to topics, as well as spaces to do practical work. For example: Data Therapy’s workshops.
  • 2 to 3-day workshops: they provide enough practice time to make it feasible to start specific projects
  • 5-day workshops: two of the organizations surveyed mentioned them as great opportunities to go through entire processes (like the data pipeline) with workshop participants
  • 10-day workshops: the longest workshop format that was mentioned in interviews; they provide enough space to go through entire processes as well as work on specific projects from scratch.

The Data Pipeline

In regard to the content of these workshops, they often start with what participants described as “data basics” (what is data, what is data journalism, etc). After this introduction, it is common for trainers to explain the process of working with data. Here, a recurring concept is the School of Data pipeline, as shown in the illustration. It is a pedagogical device created to show that “data wrangling takes place in several stages; in order to process data, it must be moved through a ‘pipeline’. […] Raw data must usually travel through every stage of the pipeline – sometimes going through one stage more than once” (Newman, 2012). While the data pipeline is heavily promoted and used by the School of Data network, participants outside of the network were found to use the pipeline model to describe the type of content they cover in workshops.

Beside the data pipeline-like methodologies, another specific type of exercice that came up during the research was the “reverse engineering” of data exercises: deconstructing existing examples to explain how they came to be and make them more relatable for the trainees.

Community events

Along with workshops, community events have developed as a way to have a more social component to events, while getting informal but practical help and advice.

  • Data clinics: those events provide space where people can develop their data skills, ask questions related to their own data and get help with challenges they are facing in their data projects
  • Data meetups: many organizations that do trainings also devote resources to hosting informal meetups where people can share learnings on their own data projects, along with getting insights into other data projects.

Datathons

Another intensive format is the Datathon, which is based on the concept of hackathons. They are often named “data expeditions”, “data dives”, “data quests” and are popular with data literacy practitioners, along with individuals who have more established data-literacy skills. Quoting a participant, “acquiring data skills requires short, intensive bursts of focus from a group, rather than the type of attention you would have during 6-8 weeks with sessions that last a couple of hours per week”.

Medium term efforts

Some of the formats do not require individuals to be removed from their workplace. The training is brought to them, either physically at their workplace, or online, allowing participation from their place of work. The online format is generally conducted over a period of several weeks or months, a few hours a week.

  • 5-week newslab model: in contexts where journalists cannot leave their newsroom, trainings can be brought to the newsroom.
  • 4-week training: in opposition to the hypothesis that led to the birth of data expeditions, this model relies on a relatively modest demand of time each week, and relies on the accumulation of practice over four weeks.
  • 1-week workshop with follow up: when there is interest in supporting a long term process, but offline training can’t be sustained over a long continuous period, follow up sessions can extend the process.

Some interviewees mentioned paying special attention to the need of developing communities of practice with alumni, in order to provide spaces where they can continue to develop expertise and learn from each other’s experiences.

Long term efforts

On the longer end of the scale, the long term efforts correspond to immersive endeavours where an individual is placed within a data project lasting anywhere from five months to a year. This takes the form of either fellowship programs, allowing an individual to gain expertise by being placed within a data project, or a mentorship program, where an individual with data expertise is placed within a data project to help build the skills of staff while working side by side.

  • Fellowship programs: tend to last from 5 months to a year. Some participants favor fellowship programs for data journalists in environments where such intensive involvement is not disruptive to the media industry. School of Data has experience in this regard, too, with its own group of School of Data fellows.
  • Research processes: some participants sustained long term capacity building through a research process that they documented. For communities that must collect and analyse their own data in the face of other challenges, such as marginalisation and illiteracy, an approach of a multi-year engagement towards empowerment can be successful. An example of this can be found in the FabRiders’ blog post series What we learned from Sex Workers.
  • Six-month projects: rather than doing it through workshops, data literacy training can take place in the form of involvement in specific projects with the guidance of a mentor.  

Online vs offline

Most of the aforementioned formats (except for the follow-up community) take place primarily offline regardless of the duration, but some online formats were brought up by participants – primarily by those whose native language isn’t English, and whose communities don’t have a wealth of data literacy resources in their language. Some mentioned MOOCs (one of the participants ran a five-week MOOC on data journalism – the first one ever in Portuguese, the language spoken in her country, Brazil); others, dedicated websites (one of the participants was prompted by the desire to introduce trends she admired in other contexts, while translating the resources that could aid in this adoption); webinars as an attempt to replicate brief offline trainings, and paying attention to social media content as a source of learning.

Choosing an effective format

Despite the wide range of formats that are used to help build data literacy, the selected format for an event often comes down to two factors: the availability of funding and the amount of time participants are willing to invest. In some contexts, journalists and/or activists can’t give up more than two days at a time; in others, they can give up to half a year. The least disruptive formats are chosen for each community. There is a noticeable difference in the types of actors and the engagements they will favor. Larger and older organizations favor intensive, long term processes with relatively few beneficiaries; smaller and younger organizations or individuals favor short-term trainings to reach larger audiences.

Interviewees focused on developing developing data literacy capacity in both individuals and organisations favor providing experiential, project-driven work. Often it’s about providing people with a dataset and getting them to develop a story from it; other times, it’s hands-on training on different parts of the data pipeline. Most interviewees so far have made an emphasis on the importance of providing opportunities for hands-on experience with data.  They also strive for having concrete outcomes for their trainings where participants can see immediate impact of their work with data.

Curriculum Sources

The research participants mentioned several sources of inspiration around data literacy, which can be found below:

In our next post ‘Measuring the Impact of Data Literacy Efforts’ we will look at how data literacy practitioners measure and evaluate their methodologies and efforts.

Flattr this!