Module Objectives:
- Objective 1: understand what ‘aid’ actually is
-
Objective 2: understand where to find sources of aid data online
-
Objective 3: understand how aid data is organised/made available online
Prerequisites/before you get started:
- None!
Table of Contents:
-
Introduction
-
What is aid?
-
What to expect from aid data?
-
How is aid data made available?
-
Where is aid data made available?
Introduction
Welcome to the world of aid data! In this first module, we’ll be starting from first principles: what do we actually mean when we say ‘aid’, and why is looking at aid data important?
Also, bear in mind that aid is just one of many financial flows going in (and out) of low-income countries, and it’s important to contextualise it amongst the wider ecosystem of financial flows before drawing any major conclusions.
What is aid?
Broadly speaking, aid is the transfer of resources (ie. money, or actual ‘things’) from one country to another; historically, this has generally been in the direction of rich countries to poorer countries. Increasingly, though, South-South cooperation is becoming more common, as is the two-way transfer of resources rather than simply as a one way transfer.
Aid isn’t just cash from government to government, though – it comes in lots of different forms. Sometimes, it is transferred to poorer countries as cash, or as food or commodities that they need; but some of it never actually leaves the donor country, and is used to help citizens of poorer countries, like students, or refugees (or, more controversially, on development consultancies in donor countries)
Bilateral and multilateral disbursements US$ billions, 2011
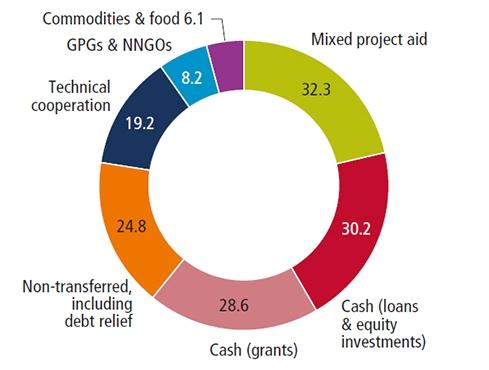
[*Image credit: **Development Initiatives’ Investments to End Poverty report*]
The way in which different donor countries actually give their ‘aid’ varies greatly; for example, some focus on debt relief, others on trade.
Aid flows can go from governments to governments (known as bilateral aid), or from governments to multilateral organisations like United Nations agencies, international organisations like the International Land Coalition, or regional organisations like the African Development Bank; known as multilateral aid, who then distribute it among various countries.
Watch out: last year, researchers found that over $22 billion of the $100 billion plus which was reported by donors as bilateral Official Development Assistance never reached the developing countries; so, bear this in mind when thinking about financial flows that are, (in theory) going to developing countries
Broadly speaking, aid can be split up into two different types: development aid, and humanitarian, or emergency, aid.
Development aid is aimed at alleviating poverty in the long term; there are many different types within this, like budget aid, project-specific aid, and charitable aid, for example. We’ll go into these in more detail in a future module. By its very nature, in theory, being planned in advance, there is much more data available about this type of aid.
Humanitarian, or emergency aid, is focused on the short term response in times of emergency; naturally, there is only short-term data available on this, and naturally no forward-looking data, as it is organised at short notice.
Get the context
To provide a little bit of context: OECD countries have set a target of providing 0.7% of their Gross National Income as ‘Official Development Assistance’. This target was set back in 1970, and reaffirmed multiple times since then; however, this doesn’t mean to say that all countries are meeting it, even 40 years later.
Here’s an embeddable, interactive chart showing how they’re doing at hitting that target, from the OECD.
It’s also worth noting that the public in many donor countries tend to wildly overestimate the amount of money that their government is spending on foreign assistance; for example, a study from 2013 showed that Americans estimate that 28% of their budget is being spent on foreign assistance. In actual fact, it’s less than 1%.
How is aid data made available?
- As high-level aggregated figures: eg. the amount of money going to/from certain countries per year, or from certain institutions. This can be useful to see global trends; for example, to see how aid flows to a certain region or country have changed over time, or how global political events have affected the split of aid data.
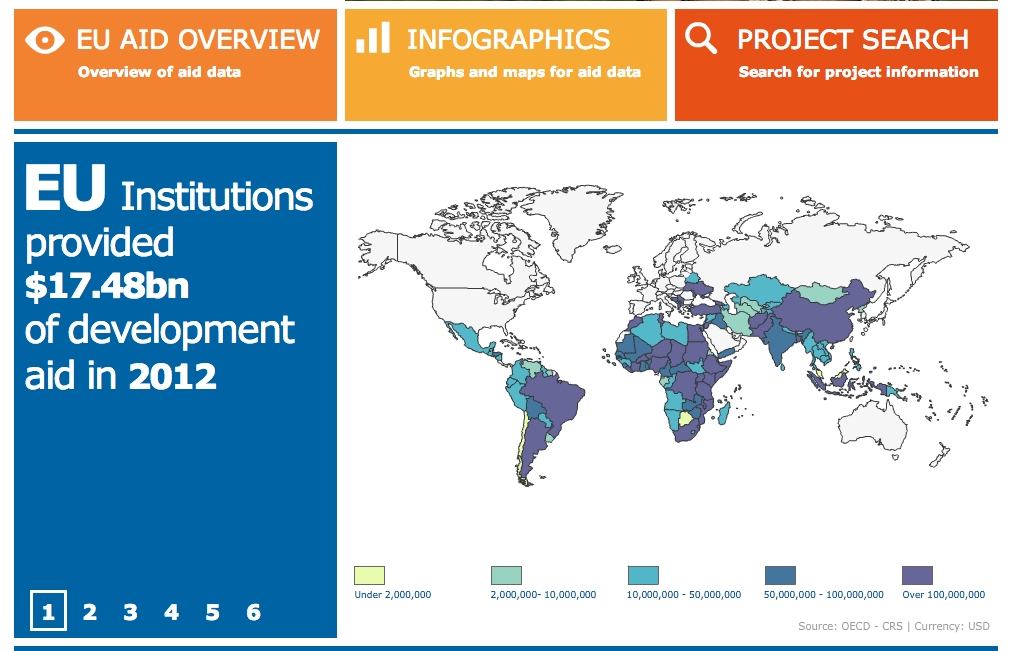
[Image credit: EU Aid Explorer portal]
- At project level: eg. how much has been spent on a certain project, over a certain amount of time. This can be good to see, for example, at what stage a project is, how long it lasted, and how much was spent on certain projects. Often in the country or donor portals, the project entries include longer documents (for example, the Call to Tender), details of the companies/organisations that were also involved on the project), and sometimes assessments of how the project went. They can be useful to get an idea of what donors are doing in certain areas.
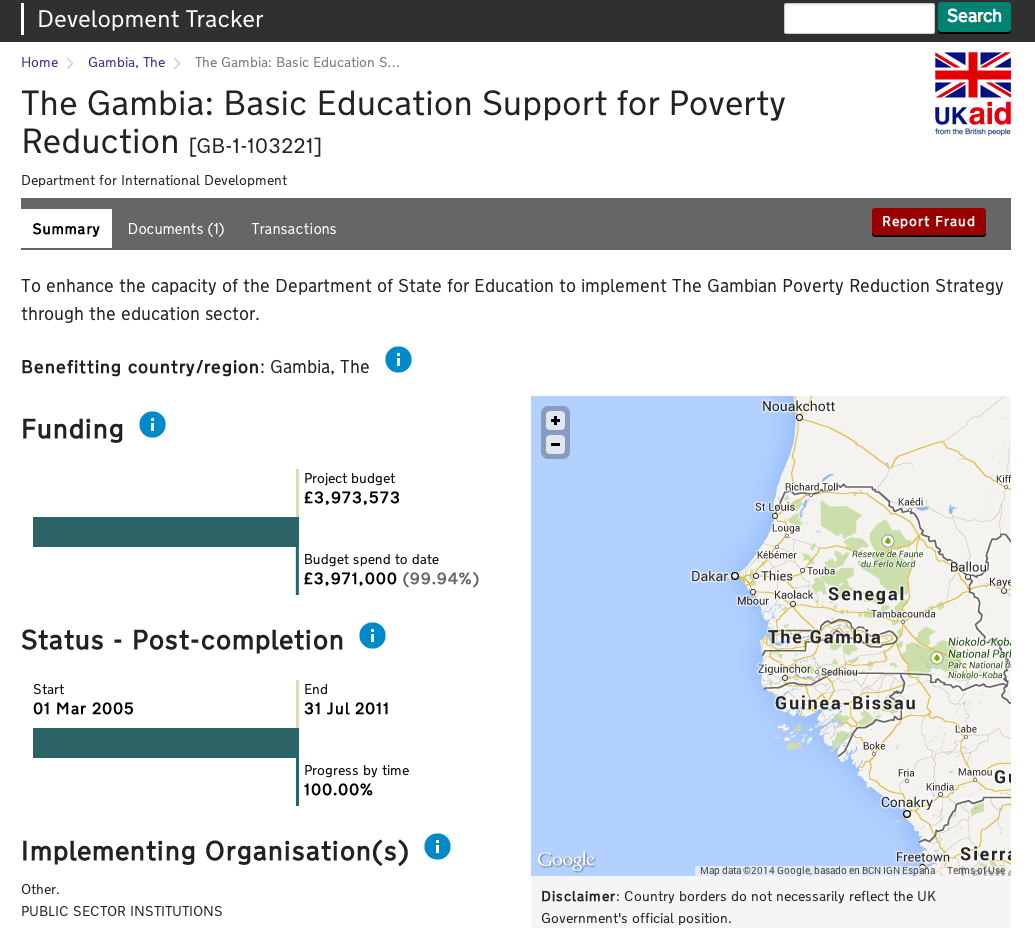
[Image credit: screenshot of DfID’s Development Tracker portal]
Project level information can also be useful to see in other ways; below is a map of Bangladesh, showing just projects from the World Bank. It really hits home how many there are, when you can see all of them at once (especially when you bear in mind that this is just from one donor).
Sometimes, you also have the option to change the ‘base map’ to show, for example, maternal health, or literacy rates. It can be interesting to compare whether these **development indicators actually correlate in any way to the projects that are taking place in those areas. For example — are projects addressing education actually taking place in areas with low literacy rates?
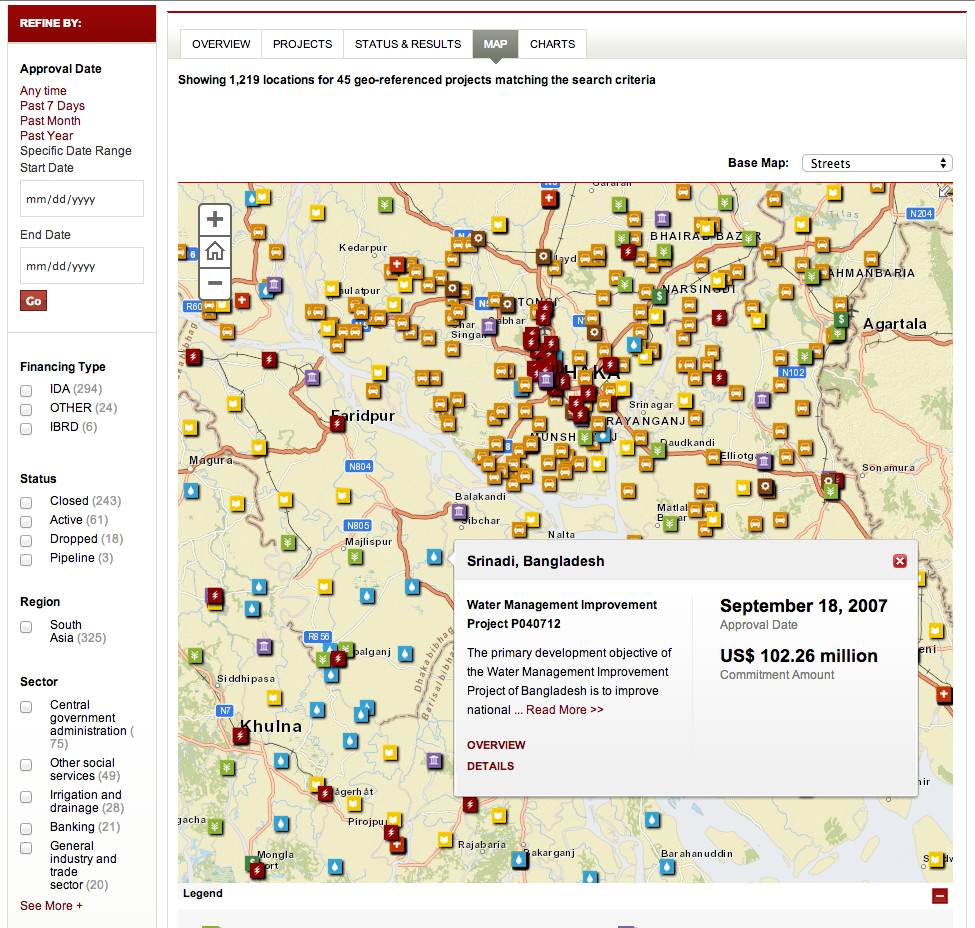
[*Image credit: **screenshot* of the World Bank’s Mapping for Results platform*]
- At a granular, more detailed level. This raw data (for example, in CSV files) is important if you want to mix it up with other data sets and find the story that way, or compare it to other indicators, or do things that aren’t featured in the data portals in which it might already appear (certain types of visualisations, for example). If you have raw data, you can properly explore it, and try out some of the tools we’ll go into later.
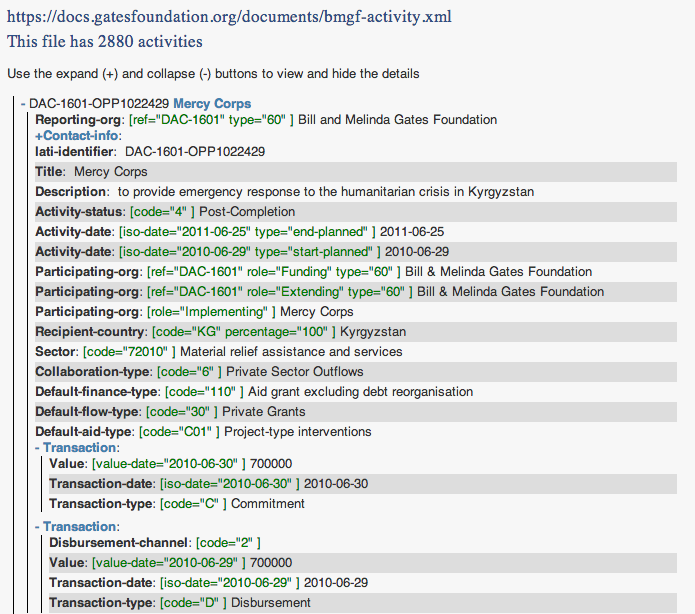
[Image credit: screenshot of the IATI Registry]
There’s lots of detail in the picture above which might not make that much sense, yet! But don’t worry – it’s just as an example to show what kind of data you can get.
Where is aid data made available?
There are lots of different ways in which aid data is made available; some, through online portals which allow you to view rather than download the data, and others as raw data, as mentioned above. Through the Tools section on the site, we aim to make it as easy as possible for you to find what you need.
Here are some of the most most useful places where you can find different bits of aid data and information.
- Organisation for Economic Co-operation and Development (OECD) makes their data available in two ways:
** Firstly, through the Development Assistance Committee’s (DAC’s) annual aggregate database, which provides comprehensive data on the volume, origin and types of aid and other resource flows. The Development Assistance Committee is made up of 29 major aid donor countries.
** Secondly, through its Creditor Reporting System, (CRS) which provides detailed information on individual aid activities, such as sectors, countries, project descriptions etc.
Both of these sources are available through their Query Wizard for International Development Statistics (QWIDS) tool, where you can find data reported from all of the 29 DAC member countries to the OECD, with regards to their activities as classified to be ‘Official Development Assistance’.
- International Aid Transparency Initiative (IATI) registry: for the organisations and governments who have chosen to publish to IATI, you can access all IATI data in raw, XML format here. The organisations can (and do) publish IATI data themselves on their own websites.
There are lots of data portals which use IATI data, if you’d rather browse through it via a more friendly user interface- we’ll go through those later.
(More information on IATI data])
-
Donor specific data portals – donors, like rich governments or multilateral agencies, increasingly make their information available through data portals. Sometimes, these data portals allow users to download the relevant raw data, but often, they simply present visualisations or chosen ‘headlines’ of information. We’ll go through a few of these later on, too.
-
Aid Information Systems, also known as Aid Management Platforms: these are country-based platforms, designed to help manage aid activities in countries. It is where donors can report their activities to aid-recipient countries, which helps a variety of people, like government officials, or donors themselves, track, coordinate and monitor aid activities into their country. Countries have tended to go down one of three routes: designing bespoke systems, or using a system from Development Gateway, or Synergy International.
Further resources:
-
Investments to end poverty report, by Development Initiatives, looking into how much Official Development Assistance actually reached low-income countries
-
OECD fact sheet; Is it ODA?
-
History of the 0.7% ODA target, from the OECD
-
The aid bundle: what you need to know, by Development Initiatives
-
A simple summary of aid from the BBC Bitesize GCSE Geography course
-
Understanding aid expenditure statistics, from the UK government.
-
Summary of different countries’ Aid Management Platforms, by Bill Anderson