Welcome to the School of Data courses. School of Data produces two types of material:
Data might sound scary sometimes - don’t worry, we’re there to guide you through! If you have any questions about the material, simply drop us a line via the mailing list
Last updated on Sep 02, 2013.
Courses: explain why something is important and help you to understand the basic decisions involved in picking particular tools or approaches and where it is worth investing your time.
Recipes: explain how to do something and may advocate using a particular tool or method to do so.
Data Fundamentals
The Data Fundamental modules provide a solid overview over the workflow with data guiding you from what data is, to how to make your data tell a story. The courses listed below should be seen as a whole, a quick overview of the elements involved in working with data.-

What is Data?
This course gives a short introduction in the world of data. If you are starting your journey into this wonderful land, this course is for you. The course covers basic concepts, different types of data and gives an introduction to machine readable data. -
Documenting your process
To make a credible and sustainable data project, you need to document your steps right from the beginning. This course contains tips and tricks and tools for doing so. -

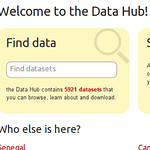
Finding Data
Don’t know where to start looking for data? This section gives an introduction to data portals and different data sources. Finally we will walk you through how to use one sample data portal. -
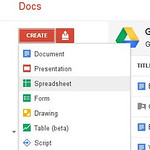
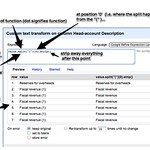
Sort and Filter
So you found and downloaded your dataset? What now? Sort and Filter introduces a powerful tool to manage data: Spreadsheets. Based on Google Spreadsheets, this Course introduces the basic functions as well how to sort and filter data to find what you might be interested in.... -
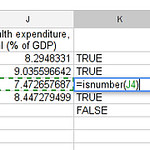
Basic Analysis
Wonder how to make sense of the data? Basic Analysis will help you to understand what your data might mean. It also introduces spreadsheet formulas and helps you calculate more values out of what you already have. -
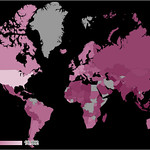
From Data to Diagrams
A picture says more than a thousand words - yeah but how do we turn a thousand words into a picture? This section will help you to understand basic data visualization and create them using Google spreadsheets. Visualizing data will help you to better understand the data you are handling. -

Common Misconceptions
Not everything is easily understood in dataland. In this course we give a short overview over common pitfalls when talking about data and how to avoid them. It can help you avoid the mistakes made as well as read other peoples claims more carefully. If you want to learn what to watch out for: join in! -
Tell me a Story
Data alone is meaningless and often boring. To understand it better you will need context. In this section we will talk about how to publish the data we worked on throughout the basic track. We will talk about how to identify key points of your data to help you use data to make your voice heard.
A Gentle Introduction to Data Cleaning
This School of Data course is a gentle introduction to reducing errors by cleaning data. It was created by the Tactical Technology Collective and gives you a clear overview what can go wrong in spreadsheets and how to fix it (if it does). Take this course if you want to learn why it is important to clean data and how to do it.-

An Introduction to Data Cleaning
In this section, learn about the “horror stories” of where data errors in spreadsheets have led to real consequences and how you can avoid them yourself. -
Formatting spreadsheets
In this section, you'll gain practical knowledge of common formatting and layout features of spreadsheets and some ideas about how to present your raw data to others so they will love you! -
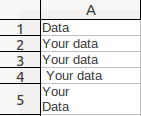
The Invisible Man in Spreadsheets
In this section, you'll learn how even characters which you cannot see can cause havoc in data analysis. The section will teach you to ghostbust white space and other non-printable characters such as carriage returns, spaces and tabs. Once you have removed them, you can get on with your analysis in peace. -
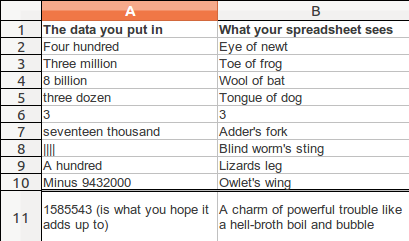
Your Data is a Witch's Brew
Three is not a number. Nor is a million. At least not when they are typed in as text in a cell in a spreadsheet. Your spreadsheet is pedantic and needs everything to be precise and consistent. Read on to learn more. -

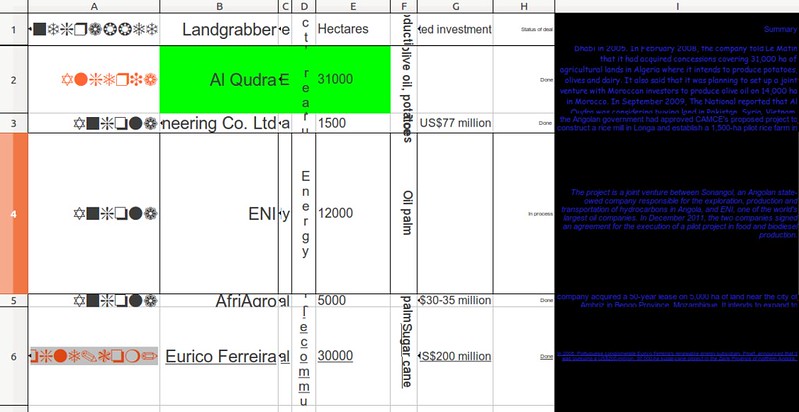
The wrong suitcase
All our spreadsheet wants from us is each cell of data to be organised and neatly packed. In this section, you will analyse data to highlight problems in the way it has been structured so as to avoid them in your own work with data.
A Gentle introduction to exploring and understanding data
The second course by Tactical Technology Collective shows how to use pivot tables to explore your data and gain insights quickly.-
A gentle introduction to exploring and understanding data
What if we told you, there is a quick way, your computer can help you to summarize and understand data? Wouldn't this be great? Check this course to learn how to use pivot tables to do this!
School of Data Journalism
-

Getting Stories from Data
When investigating data - do you start from a hypothesis - or simply get some data and dig around? Award-winning journalists Caelainn Barr and Steve Doig explain their approaches... -
Spending Stories
How do you work with, clean up and present your government's spending information. A quick overview of a fantastic tool for working with government spending information. An introduction to Europe's Financial Transparency Information System. -
Making Data Pretty
There are many fantastic off-the-shelf tools for visualising data. Join Dan Nguyen, Mirko Lorenz and Simon Rogers for a whistlestop tour through some of the staples of a data journalist's workbench. -

Asking for Data
Ever wanted to know more about making a Freedom of Information request? Want to know how this works internationally? This course is for you.
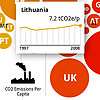
A Gentle Introduction to Geocoding
-
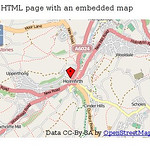
A gentle introduction to Geocoding
Need to put your data on a map but it doesn't contain Latitude and Longitude values? Read on!
A Gentle Introduction to Extracting Data
-

A gentle introduction to Extracting Data from Websites
Learn how to scrape without code in 5 minutes and when you might need to invest time in more sophisticated techniques. -

PDF busters
Far too much data is trapped in PDFs. In order to be able to work with, analyse and visualise data, we need it in machine-readable formats. It's often not easy to the data out again, but sometimes possible - find out how here.
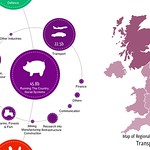
Working with Budgets and Spending Data
In this course, we will take you through the steps involved working with budget and spending data. In the process, you’ll learn how to wrangle and clean up some of the most common errors which we see in spending and budget data, as well as doing some dataset gymnastics, such as transposition and cleanup before creating a simple visualisation at the end. If you don’t have your data yet, or don’t have it in machine-readable format - take a look at the two courses above on extracting data, we start from cleaning up and formatting your data.-

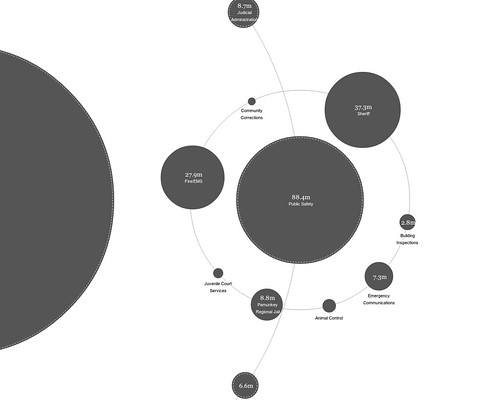
Spending vs. Budgets
Before we begin working with the data, let's take a closer look at the difference between budgets and spending data - what questions is it possible to answer with this data? -
Categorisation and Reference Data
The most interesting data work happens when you combine more than one type of data. In this section, we introduce you to reference data, highlighting a couple of examples particularly relevant to spending and budgets. -
Cleaning Data
A quick introduction to why spending data often needs cleaning, following into a recipe for cleaning spending data with Open Refine. -
Classifying financial data
Sometimes you will need to classify your financial data, for example, to reflect services that people care about or to conform to internationally recognised standards.