You are browsing the archive for Nigeria.

Data is a Team Sport: One on One with Daniela Lepiz

- July 3, 2017 in Community, Data Blog, Event report

Data is a Team Sport is a series of online conversations held with data literacy practitioners in mid-2017 that explores the ever evolving data literacy eco-system.

To subscribe to the podcast series, cut and paste the following link into your podcast manager : http://feeds.soundcloud.com/users/soundcloud:users:311573348/sounds.rss or find us in the iTunes Store and Stitcher.

[soundcloud url=”https://api.soundcloud.com/tracks/331054739″ params=”color=ff5500&auto_play=false&hide_related=false&show_comments=true&show_user=true&show_reposts=false” width=”100%” height=”166″ iframe=”true” /]

This episode features a one on one conversation with Daniela Lepiz, a Costa Rican data journalist and trainer, who is currently the Investigation Editor for CENOZO, a West African Investigative Journalism Project that aims to promote and support cross border data investigation and open data in the region. She has a masters degree in data journalism from the Rey Juan Carlos University in Madrid, Spain. Previously involved with OpenUP South Africa working with journalists to produce data driven stories.  Daniela is also a trainer for the Tanzania Media Foundation and has been involved in many other projects with South African Media, La Nacion in Costa Rica and other international organisations.

Notes from the conversation

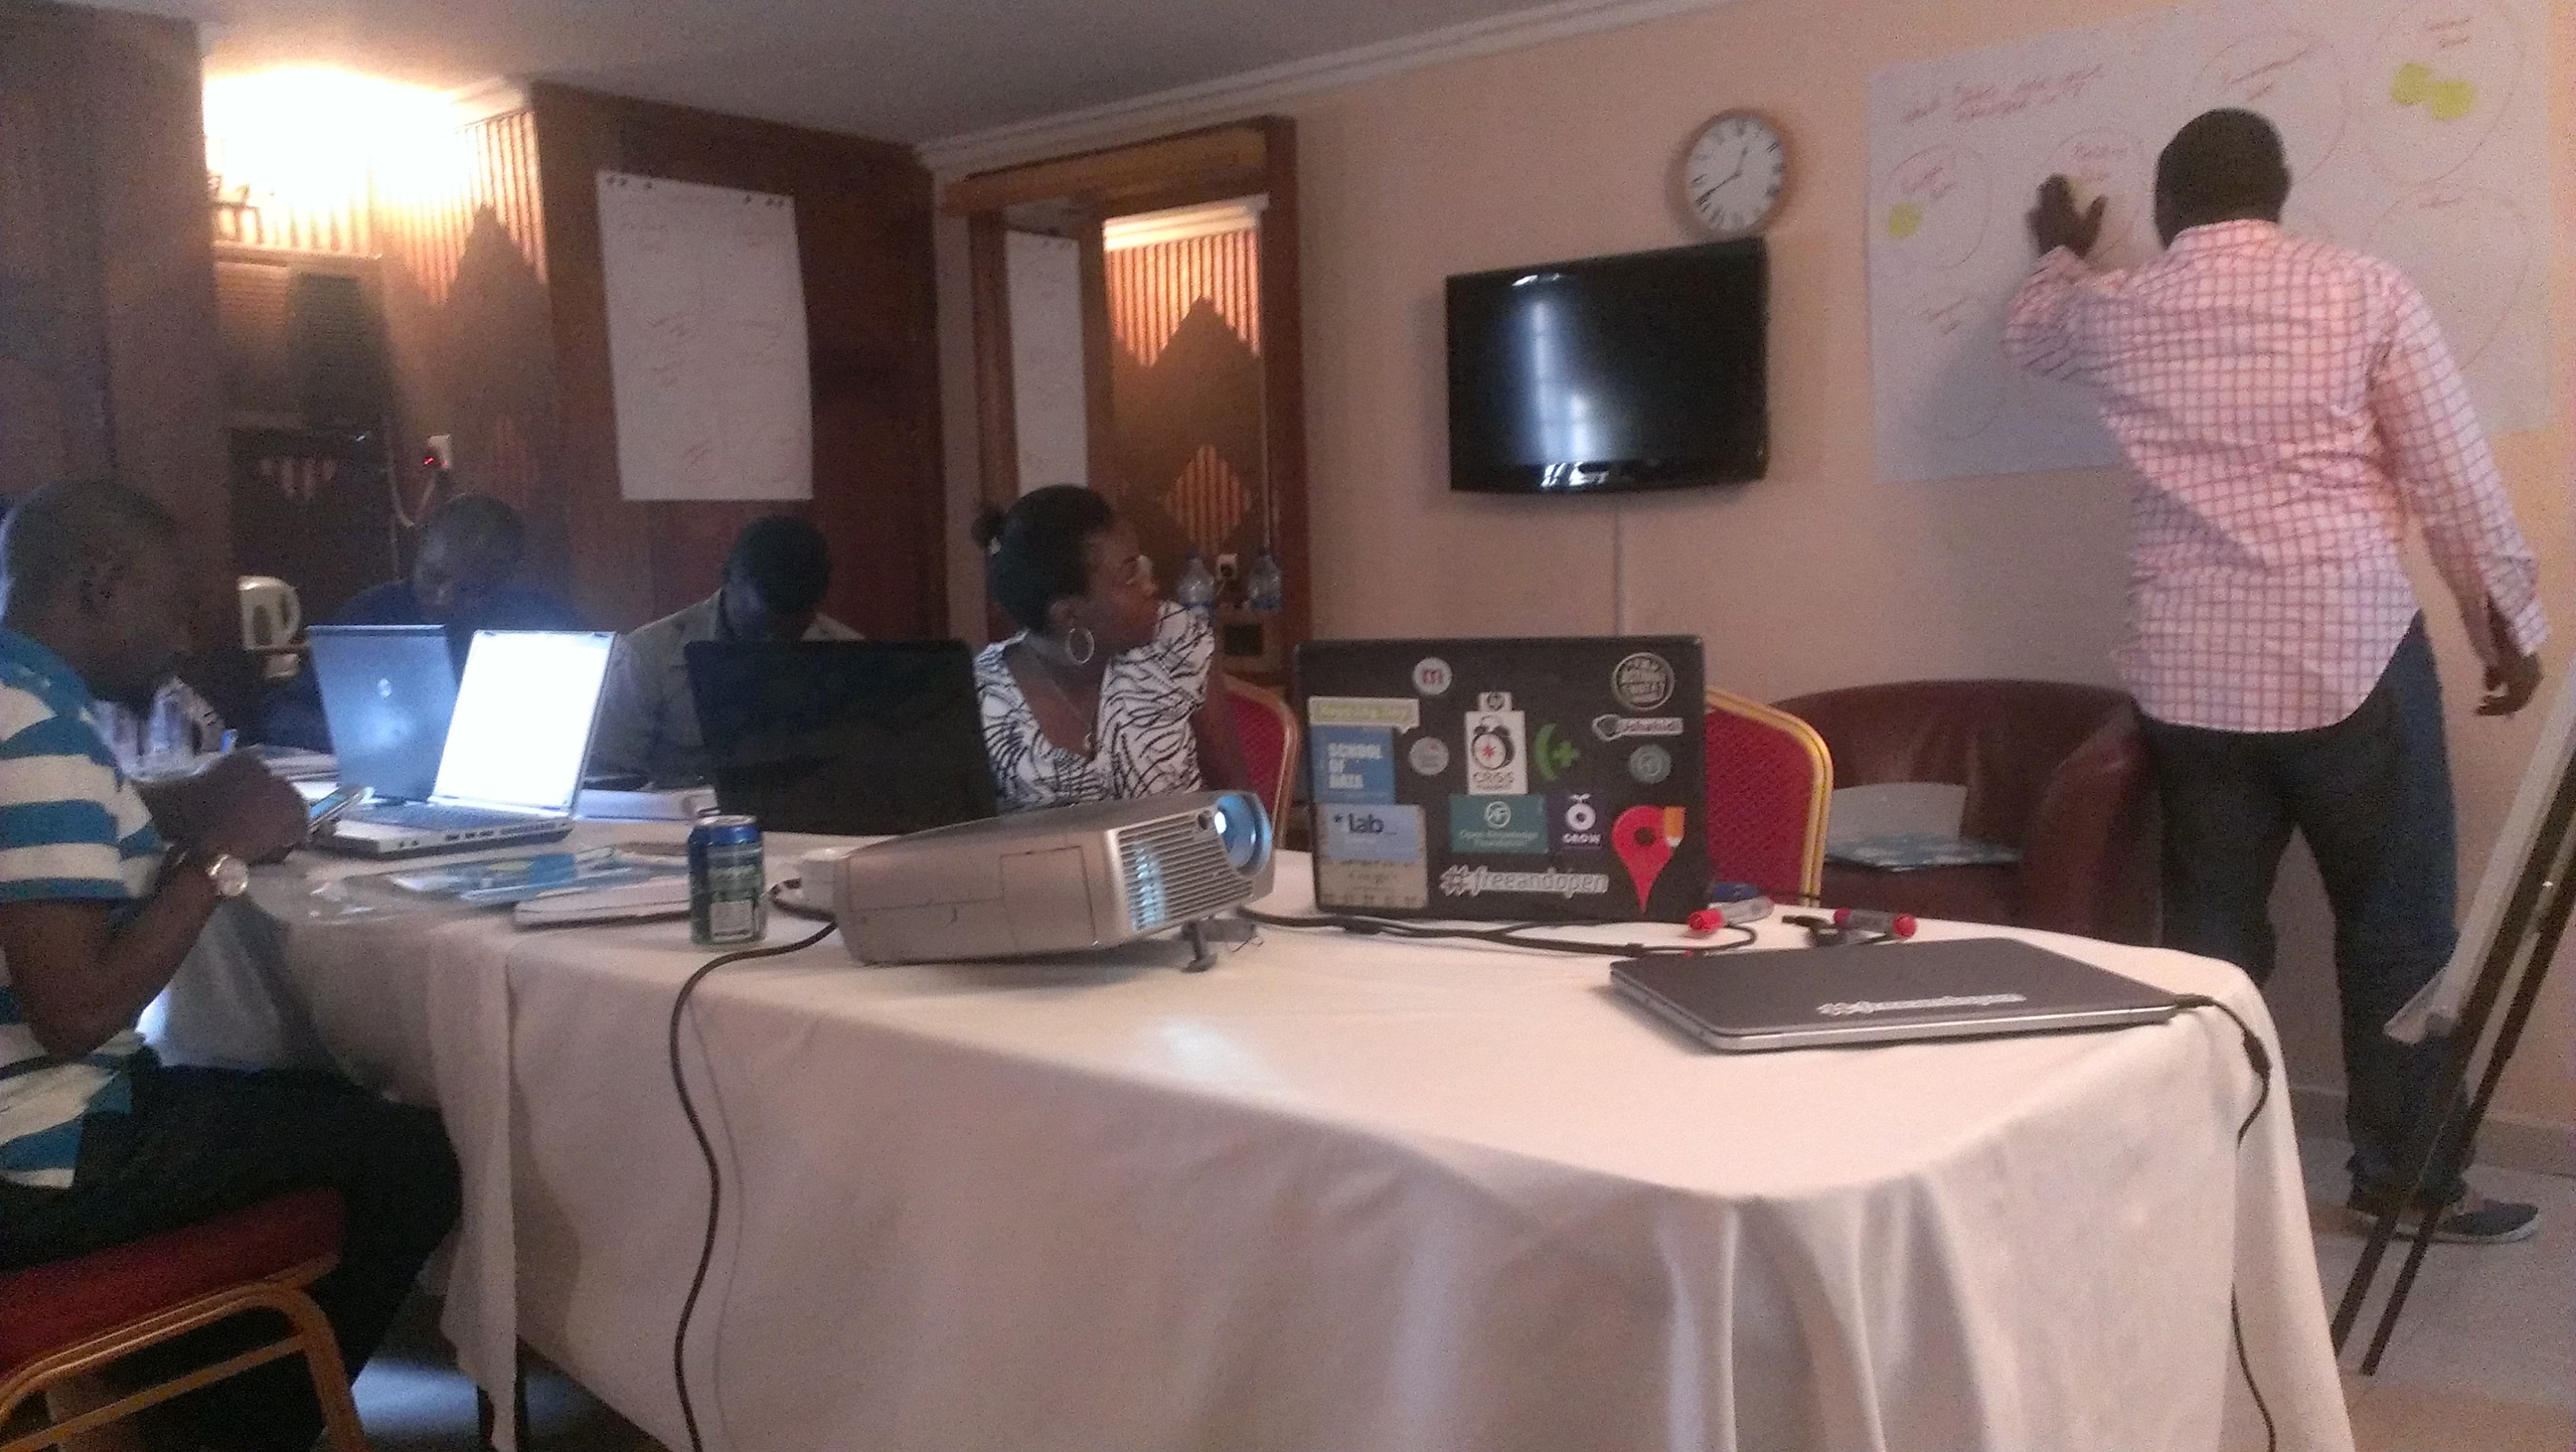
Daniela spoke to us from Burkina Faso and reflected on the importance of data-driven journalism in holding power to accountability. Her project aims to train and support  journalists working across borders in West Africa to use data to expose corruption and human rights violation. To identify journalists to participate in the project, they seek individuals who are experienced, passionate and curious. The project engages media houses, such as Premium Times in Nigeria, to ensure that there are respected outlets to publish their stories. Daniela raised the following points:

  • As the media landscape continues to evolve, data literacy is increasing becoming a required competency
  • Journalists do not necessarily have a background in mathematics or statistics and are often intimidated by the idea of having to these concepts in their stories.
  • Data stories are best done in teams of people with complementary skills. This can go against a traditional approach to journalism in which journalists work alone and tightly guard their sources.
  • It is important that data training programmes also work with, and better understand the needs of journalists.

Resources she finds inspiring

Her blogs posts

The full online conversation:

[youtube https://www.youtube.com/watch?v=9l4SI6lm130]

Daniela’s bookmarks!

These are the resources she uses the most often.

.Rddj – Resources for doing data journalism with RComparing Columns in Google Refine | OUseful.Info, the blog…Journalist datastores: where can you find them? A list. | Simon RogersAidInfoPlus – Mastering Aid Information for Change

Data skills

Mapping tip: how to convert and filter KML into a list with Open Refine | Online Journalism Blog
Mapbox + Weather Data
Encryption, Journalism and Free Expression | The Mozilla Blog
Data cleaning with Regular Expressions (NICAR) – Google Docs
NICAR 2016 Links and Tips – Google Docs
Teaching Data Journalism: A Survey & Model Curricula | Global Investigative Journalism Network
Data bulletproofing tips for NICAR 2016 – Google Docs
Using the command line tabula extractor tool · tabulapdf/tabula-extractor Wiki · GitHub
Talend Downloads

Github

Git Concepts – SmartGit (Latest/Preview) – Confluence
GitHub For Beginners: Don’t Get Scared, Get Started – ReadWrite
Kartograph.org
LittleSis – Profiling the powers that be

Tableau customized polygons

How can I create a filled map with custom polygons in Tableau given point data? – Stack Overflow
Using Shape Files for Boundaries in Tableau | The Last Data Bender
How to make custom Tableau maps
How to map geographies in Tableau that are not built in to the product (e.g. UK postcodes, sales areas) – Dabbling with Data
Alteryx Analytics Gallery | Public Gallery
TableauShapeMaker – Adding custom shapes to Tableau maps | Vishful thinking…
Creating Tableau Polygons from ArcGIS Shapefiles | Tableau Software
Creating Polygon-Shaded Maps | Tableau Software
Tool to Convert ArcGIS Shapefiles into Tableau Polygons | Tableau and Behold!
Polygon Maps | Tableau Software
Modeling April 2016
5 Tips for Making Your Tableau Public Viz Go Viral | Tableau Public
Google News Lab
HTML and CSS
Open Semantic Search: Your own search engine for documents, images, tables, files, intranet & news
Spatial Data Download | DIVA-GIS
Linkurious – Linkurious – Understand the connections in your data
Apache Solr –
Apache Tika – Apache Tika
Neo4j Graph Database: Unlock the Value of Data Relationships
SQL: Table Transformation | Codecademy
dc.js – Dimensional Charting Javascript Library
The People and the Technology Behind the Panama Papers | Global Investigative Journalism Network
How to convert XLS file to CSV in Command Line [Linux]
Intro to SQL (IRE 2016) · GitHub
Malik Singleton – SELECT needle FROM haystack;
Investigative Reporters and Editors | Tipsheets and links
Investigative Reporters and Editors | Tipsheets and Links

SQL_PYTHON

More data

2016-NICAR-Adv-SQL/SQL_queries.md at master · taggartk/2016-NICAR-Adv-SQL · GitHub
advanced-sql-nicar15/stats-functions.sql at master · anthonydb/advanced-sql-nicar15 · GitHub
2016-NICAR-Adv-SQL/SQL_queries.md at master · taggartk/2016-NICAR-Adv-SQL · GitHub
Malik Singleton – SELECT needle FROM haystack;
Statistical functions in MySQL • Code is poetry
Data Analysis Using SQL and Excel – Gordon S. Linoff – Google Books
Using PROC SQL to Find Uncommon Observations Between 2 Data Sets in SAS | The Chemical Statistician
mysql – Query to compare two subsets of data from the same table? – Database Administrators Stack Exchange
sql – How to add “weights” to a MySQL table and select random values according to these? – Stack Overflow
sql – Fast mysql random weighted choice on big database – Stack Overflow
php – MySQL: Select Random Entry, but Weight Towards Certain Entries – Stack Overflow
MySQL Moving average
Calculating descriptive statistics in MySQL | codediesel
Problem-Solving using Graph Traversals: Searching, Scoring, Ranking, …
R, MySQL, LM and quantreg
26318_AllText_Print.pdf
ddi-documentation-english-572 (1).pdf
Categorical Data — pandas 0.18.1+143.g3b75e03.dirty documentation
python – Loading STATA file: Categorial values must be unique – Stack Overflow
Using the CSV module in Python
14.1. csv — CSV File Reading and Writing — Python 3.5.2rc1 documentation
csvsql — csvkit 0.9.1 documentation
weight samples with python – Google Search
python – Weighted choice short and simple – Stack Overflow
7.1. string — Common string operations — Python v2.6.9 documentation
Introduction to Data Analysis with Python | Lynda.com
A Complete Tutorial to Learn Data Science with Python from Scratch
GitHub – fonnesbeck/statistical-analysis-python-tutorial: Statistical Data Analysis in Python
Verifying the email – Email Checker
A little tour of aleph, a data search tool for reporters – pudo.org (Friedrich Lindenberg)
Welcome – Investigative Dashboard Search
Investigative Dashboard
Working with CSVs on the Command Line
FiveThirtyEight’s data journalism workflow with R | useR! 2016 international R User conference | Channel 9
Six issue when installing package · Issue #3165 · pypa/pip · GitHub
python – Installing pip on Mac OS X – Stack Overflow
Source – Journalism Code, Context & Community – A project by Knight-Mozilla OpenNews
Introducing Kaggle’s Open Data Platform
NASA just made all the scientific research it funds available for free – ScienceAlert
District council code list | Statistics South Africa
How-to: Index Scanned PDFs at Scale Using Fewer Than 50 Lines of Code – Cloudera Engineering Blog
GitHub – gavinr/geojson-csv-join: A script to take a GeoJSON file, and JOIN data onto that file from a CSV file.
7 command-line tools for data science
Python Basics: Lists, Dictionaries, & Booleans
Jupyter Notebook Viewer

PYTHON FOR JOURNALISTS

New folder

Reshaping and Pivot Tables — pandas 0.18.1 documentation
Reshaping in Pandas – Pivot, Pivot-Table, Stack and Unstack explained with Pictures – Nikolay Grozev
Pandas Pivot-Table Example – YouTube
pandas.pivot_table — pandas 0.18.1 documentation
Pandas Pivot Table Explained – Practical Business Python
Pivot Tables In Pandas – Python
Pandas .groupby(), Lambda Functions, & Pivot Tables
Counting Values & Basic Plotting in Python
Creating Pandas DataFrames & Selecting Data
Filtering Data in Python with Boolean Indexes
Deriving New Columns & Defining Python Functions
Python Histograms, Box Plots, & Distributions
Resources for Further Learning
Python Methods, Functions, & Libraries
Python Basics: Lists, Dictionaries, & Booleans
Real-world Python for data-crunching journalists | TrendCT
Cookbook — agate 1.4.0 documentation
3. Power tools — csvkit 0.9.1 documentation
Tutorial — csvkit 0.9.1 documentation
4. Going elsewhere with your data — csvkit 0.9.1 documentation
2. Examining the data — csvkit 0.9.1 documentation
A Complete Tutorial to Learn Data Science with Python from Scratch
For Journalism
ProPublica Summer Data Institute
Percentage of vote change | CARTO
Data Science | Coursera
Data journalism training materials
Pythex: a Python regular expression editor
A secure whistleblowing platform for African media | afriLEAKS
PDFUnlock! – Unlock secured PDF files online for free.
The digital journalist’s toolbox: mapping | IJNet
Bulletproof Data Journalism – Course – LEARNO
Transpose columns across rows (grefine 2.5) ~ RefinePro Knowledge Base for OpenRefine
Installing NLTK — NLTK 3.0 documentation
1. Language Processing and Python
Visualize any Text as a Network – Textexture
10 tools that can help data journalists do better work, be more efficient – Poynter
Workshop Attendance
Clustering In Depth · OpenRefine/OpenRefine Wiki · GitHub
Regression analysis using Python
DataBasic.io
DataBasic.io
R for Every Survey Analysis – YouTube
Git – Book
NICAR17 Slides, Links & Tutorials #NICAR17 // Ricochet by Chrys Wu
Register for Anonymous VPN Services | PIA Services
The Bureau of Investigative Journalism
dtSearch – Text Retrieval / Full Text Search Engine
Investigation, Cybersecurity, Information Governance and eDiscovery Software | Nuix
How we built the Offshore Leaks Database | International Consortium of Investigative Journalists
Liz Telecom/Azimmo – Google Search
First Python Notebook — First Python Notebook 1.0 documentation
GitHub – JasonKessler/scattertext: Beautiful visualizations of how language differs among document types


Flattr this!

The 2nd Nigerian Open Data Party, a Great Success

- January 20, 2016 in Event report, Fellowship

The open data scene is rising in Nigeria, and it has seen the birth of a vibrant community: to the North, Connected Development; to the West, BudgIT, Orodata, Code for Nigeria; to the South, SabiHub and NODA, to mention a few. We all came together on the 11th and 12th of December 2015 to hold the second edition of the Open Data Party, the biggest open data event in Nigeria, with support from School of Data, Code for Nigeria and the Heinrich Böll Foundation.

The first edition was hosted by Sabi Hub in Benin City, Edo State, Nigeria, in collaboration with the Benson Idahosa University. The event, described as the highlight of Nigerian Open Data Conferences in 2015, brought together data enthusiasts among social workers, journalists, government officials, academics, and activists from all over Nigeria. They learned and shared skills around using data to enhance their activities.

Participants at the event.

Participants at the event.

The 2015 event was focused on waste management and saw a wealth of notable speakers/facilitators present. This included: Katelyn Rogers (Open Knowledge International Project Manager) Adam Talsma (Senior Program Designer and Nigeria Country Manager at Reboot) Stanley Achonu (Operations Lead at BudgIT), Temi Adeoye (Lead Technologist at Code for Nigeria), Nonso Jideiofor (Reboot), Joshua Olufemi  (Premium Times Nigeria), Ayodele Adeyemo (Nigeria Open Data Access),Tina Armstrong Ogbonna (Reporter with Radio Nigeria and Freelance Journalist), Oludotun Babayemi and Hamzat Lawal (Co-Creator of Follow The Money in Nigeria) and the hostess Nkechi Okwuone (School of Data Fellow, manager the Edo State Open Data Portal and Sabi Hub).

Facilitators at Open Data Party Benin

Facilitators at Open Data Party Benin

23779203736_0bb169dbf0_z

Skill Share Session

Day 1 of the event featured sessions on Data Pipelines (Finding Data, Getting Data, Scrapping Data, Analyzing and Publishing Data) and Ground Truthing Data using Mobile Phones. Other sessions that ran concurrently dealt with Data Scraping Tools and Digital Security and Privacy. The day ended with participants encouraged to document what they wanted to learn or teach on the unconference session of Day 2

23722868791_56ca340c41_z

Participants Documented their ares of interest – Either Learning or Teaching for the Unconference session

Day 2 kicked off with a panel session on waste management challenges in the Edo State and how it could be tackled from an advocacy, entrepreneurial and technology perspective.

Immediately following was a 2-hour long unconference session focusing on the learning interests written by participants on sticky notes. This included a Follow the Money session, securing funding for your ideas/projects and maximizing web analytics.

Rounding up Day 2 was the Ideation session which began with Temi Adeoye speaking to participants on how to better understand data problems, getting divergent and convergent ideas as well as thinking outside the box to get good results.

Participants formed groups and brainstormed on developing a tool/platform to solve challenges in waste management with emphasis on recycling, collection and dumping. The session lasted for 2 hours and had a total of 16 participants who were each given 3 minutes to make a presentation of their ideas to a panel.

23814570195_abf0b9e9a9_z

Winners of the Ideation Session

The winning idea came from Abdul Mohammed from Kano and Emmanuel Odianosen from Edo State who will be developing  a reporting tool to help waste managers (collectors) efficiently collect waste in communities. They were rewarded with a thousand British Pounds (£1,000) provided by School of Data, along with an incubation and mentorship package provided by Sabi Hub, Code for Nigeria and Connected Development.

And of course we went partying properly at the popular Subway Lounge In Benin City Nigeria!. The event attendees expressed delight at the effort of the organizers who ensured that the event was world class and they all look forward to a bigger event come 2016. A big Thank You to School of Data, OD4D, Code for Nigeria, Sabi Hub, Connected Development, Heinrich Böll Foundation and the Benson Idahosa University for making the event a success!

View details about the event here

See pictures and videos here


Flattr this!

Data visualisation or Data narration? Data in Radio Stories

- January 18, 2016 in Uncategorized

For an outsider looking at Nigeria’s news media lately, it would seem that the only things in the mind of Nigerians are politics or security-related. Breaking news are aplenty while more involved stories, either investigative or reporting on community issues, are scarce.

This is a problem, but what can we do about it? Development Watch, an initiative by Journalist for Social Development Initiative, hopes to solve this problem. They have plans for a different kind of journalism, providing objective analysis of social development issues and promoting inclusive growth across Africa. And to live up to their goal of creating quality journalism, they decided to facilitate a data journalism session on November 30, 2015, at the occasion of the launch of the main part of their web platform.

Data Journalism AbujaMore than 20 journalists were present: 15 from the broadcast, 5 from the print and the others from the new media. Beyond Google Alerts, most of them had little knowledge of the useful tools for digital journalism, and even less about where to find available data in Nigeria. This was expected: we hear this from 80% of the participants to datajournalism trainings. Luckily, the point of those trainings is to familiarize them with the available tools and sources.

“To find data for my reports, I only depend on references from other works, or request a meeting with concerned organizations, as I do not know where to go to, I find this difficult for my work”  said Sam Adeko of Punch Newspapers.

 According to a recent poll by NOI Polls, a polling organisation in Nigeria, most people in the country access daily news via the radio (67%), followed by television, social media and newsprint. With this information in mind, we try to tailor our datajournalism trainings to take into account stories for radio and television, in addition to the use of tools like Infogr.am, essentially useful for print and social media.

But before talking about visualising data, we had to cover some basic techniques. In this training, as is the case in many other ones, 90% of the participants used Google search to look up information, but few of them really knew how to search effectively. For example, you can search for specific content on a website by adding ‘site:example.com’ to your search phrase, which will prompt Google to only return results from the site you’ve specified. You can even narrow it down further by using ‘site:example.com/pages/’, and you’ll only see results that match that pattern.

Another useful tool that was introduced was Google Trends, which allow to find which search terms are trending on Google. “I really want to know how much people are interested in President Muhammadu Buhari of Nigeria compared to the President of Rwanda, Paul Kagame. Especially in recent times, this can give me an insight on how important Nigeria is over Rwanda” explained Roluke Ogundele of the Africa Independent Television. All you need do is to enter a couple of common search phrases and you will get how this has been trending over time. We also talked about Twitter, a micro-blogging service that is becoming more widely used in Nigeria. To discover public conversations about a link, you just paste the URL you’re interested in into the search box, and then possibly hit ‘more tweets’ to see the full set of results.

When the datavisualisation session eventually came, we asked the question of whether to visualize or not, and how. Tools like Google Fusion Tables, Tableau, Dipity and others make it easier than ever to create maps, charts, graphs useful for newsprint, social media, and television. But what happens when you broadcast on the radio? Because people only listen, the need of getting a story out of the data, rather than just a visualisation, is more obvious. Stories can be told in a captivating way on radio, and they can come from data. “So if you are a broadcast journalist in the radio – you have no excuse, dive in by looking at the problem you want to solve first, via the radio (also works for other media), then find and get the data, and tell your story to the world” said Gloria Ogbaki of Ray Power FM

In Nigeria, data journalism is nascent, and opportunities abound. As more new journalists get into the field, thinking of which sector to dive into, there is a need for newsrooms to innovate by, for example, embedding data analysts and Information technology experts with producers of news.

As you can see, most of us never knew what data journalism is, but at the end of this training, we were all excited, and can now go back to incorporate this into our work. We hope this is not a one -time training, we need more of it in our newsrooms” said Okoye Ginka of the News Agency of Nigeria


Flattr this!

Making open data accessible to data science beginners

- November 6, 2015 in Data Blog, Fellowship

If you’re reading this, I suspect you’re already familiar with open data, data science and what it entails. But if that’s not the case, fret not, here are a few beginner courses from School of Data to get you started.

As new data scientists, we need easy access to substantial, meaningful data without the restrictions of cost or licenses. It’s the best way to hone our new skillset, get objective answers to questions we have and provide solutions to problems. This is a fact that has been acknowledged by leading data scientists. So, how can new data scientists get easy and timely access to this type of data?

Open Data Companion (ODC) is a free mobile tool that has been created to provide quick, easy and timely access to open data. ODC acts as a unified access point to over 120 open data portals and thousands of datasets from around the world; right from your mobile device. All crafted with mobile-optimised features and design.

ODC was created by Utopia Software, a developer company being mentored by the Nigerian School of Data fellow in the open data community of SabiHub in Benin city, Nigeria.

We believe ODC successfully addresses some key problems facing open data adoption; particularly on the mobile platform.

  • With the growth of open data around the world, an ever-increasing number of individuals (open data techies, concerned citizens, software developers and enthusiasts), organisations (educational institutions, civic duty and civil society groups) and many more continually clamour for machine-readable data to be made available in the public domain. However, many of these interested individuals and organisations are unaware of the existence of relevant portals where these datasets can be accessed and only stumble across these portals after many hours of laborious searching. ODC solves this problem by providing an open repository of available open data portals through which portal datasets can be accessed in a reliable yet flexible manner.

  • The fact that mobile platforms and mobile apps are now a dominant force in the computing world is beyond dispute. The percentage of mobile apps used on a daily basis and their use-rate continues to grow rapidly. This means that mobile devices are now one of the easiest and fastest means of accessing data and information; if more people are to be made aware of the vast array of available open data producers, the open data at their disposal and how to use them, then open data needs a significant mobile presence with the mobile features users have come to expect. ODC tackles this problem effectively by providing a fast mobile channel with a myriad of mobile-optimised features and an easy design.

What can ODC offer data scientists? Here’s a quick run-through of its features:

  • access datasets and their meta-data from over 120 data portals around the world. Receive push notification messages when new datasets are available from chosen data portals. This feature not only ensures users get easy access to the data they need, but it also provides timely announcements about the existence of such data.

    image alt text

  • preview data content, create data visualisations in-app and download data content to mobile device. The app goes beyond a simple “data browser” by incorporating productivity features which allow users to preview, search and filter datasets. Data scientists can also start working on data visualisations likes maps and charts from within the app.

    image alt text

  • translate dataset details from various languages to your preferred language. This feature comes in really handy when users have to inspect datasets not provided in their native language. For instance, when investigating the state of agriculture and hunger across Africa, available datasets (and meta-data) would be in different languages (such as English, French, Swahili etc). ODC helps to overcome this language barrier.

  • bookmark/save datasets for later viewing and share links to datasets on collaborative networks, social media, email, sms etc., right from the app.

Armed with this tool, novice data scientists, and our more experienced colleagues, can start wrangling data with greater ease and accessibility. Do you have ideas or suggestions on how ODC can work better? Please do leave a reply!

Flattr this!

School of Data Fellows: What Are They Up To?

- October 8, 2015 in Fellowship

Our brilliant 2015 School of Data Fellows are a busy bunch! We asked them to reflect on the first half of their fellowships; here’s a roundup of just a few of the highlights:

  • Camila has run numerous training events, working with Abriendo Datos Costa Rica and with Costa Rican university students. She has also run two data expeditions and a workshop in Mexico City in the NGO Festival FITS – in total, Camila has trained 177 participants! Camila looks forward to engaging wider audiences of Costa Rican NGOs and journalists in data-literacy training during the remainder of her fellowship.

  • In Macedonia, Goran has been making great progress on the Open Budgets project and work is underway with the Metamorphosis Foundation on upgrading their ‘Follow The Money’ website. He has also been busy finalising contracts with the winners of the Open Data Projects competition and facilitating their kick-off. Goran is also finalising his first skillshare on TimelineJS, which we look forward to!

  • In Nepal, Nirab has responded to the devastation caused by April’s earthquake by supporting all manner of data-related support, working with a host of CSO’s, INGOs, government agents, technologists, journalists and researchers. He has a particular interest in post-disaster transport management and has trained 78 road engineers in OpenStreetMap, who are utilising this knowledge across 36 different districts of Nepal!

  • In Ecuador, Julio has been busy preparing a workshop for Campus Party Ecuador 2015, a fantastic technology festival kicking off later this week. He has also been collaborating recently with Innovation Lab Quito on an exciting upcoming training event in October and also with SocialTIC and the Ecuadorian Journalist Forum on an event planned for November.

  • Nkechi attended the Africa Open Data Conference (AODC) in Tanzania recently, where she did some fantastic networking at the School of Data booth. She also organised an Open Data Workshop for approximately 25 Tanzanian CSOs and journalists at the conference, comprising skill shares on data advocacy, finding and verifying data, the data pipeline, scraping and visualizing. Nkechi looks forward to consolidating her work in strengthening the Nigerian data-literacy community in the coming months of her fellowship.

  • In the Phillipines, Sheena has worked extensively on data skills for effective disaster response, organising successful training events in Northern Mindanao and Leyte with a total of 77 participants. She recently participated in in the Forum on Open Government Data organized by the Knowledge for Development Center, which provided powerful insights regarding School of Data’s role in supporting the Open Data movement. Sheena is focused on extending her network of local NGOs and media actors in the coming months, as she makes progress to her goal of establishing a local School of Data instance.

  • In Ghana, David has hosted several workshops, including a data scraping workshop with Code for Ghana, and another during the Africa Open Data Conference with fellow School of Data and Code for Africa colleagues. He has presented two online skillshares on Data Scraping and R programming which have received very positive feedback! David is currently organising the first H/H Accra meetup. He intends to focus on data journalism for the rest of his fellowship, in anticipation of the national elections that will happen in Ghana next year.

Flattr this!

Open Data Party Akure – Treading new grounds in Nigeria!

- September 3, 2015 in Events, Fellowship


Cross-Section of participants

Cross-Section of participants

We took the open data party to the Southwest of Nigeria with the goal of building a data literate community in Nigeria. School of Data collaborated with the Nigeria Open data Access (NODA) team of the University of Technology Akure, to host the first open data event in that region.

It was a 7 hours awareness and skill share session. Similarly to our previous event, the participants had little or no knowledge of open data. one of the participant said:

I only just saw the post about the open data party and came out of curiosity to know what it is all about

Their interest was in knowing what open data is and how they can apply it to their work as a business or in advocacy. Some misconceptions had first to be cleared, as some of the participants thought of open data as a tool, a specific project or even a software. So, how do you explain open data to a group of 30 where no one knows exactly what is it?

We split the event into two sessions  : one was about awareness while the other was focused on skillsharing. The awareness session featured talks about open data, its relevance and case studies. We took a practical example of a participant who is currently working on a project to automate course attendance in her school. She said afterwards –

I now have a better perspective and will work towards automating and opening attendance data. Students will be able to access it for monitoring their performance.

We introduced them to our data Pipeline and gave them success stories. For those without projects, we succeeded in spurring them to research their options as they appreciated the leverage they could get using open data.

In the skillsharing session, participants were more interested in learning how to visualize the plenty of rows and columns they had stacked up in folders. Sessions in visualization, storytelling, advocacy and even fund raising for NGOs, were held concurrently.

Participants were really excited to meet new tools like Tableau, CartoDB, E-draw and even Excel. Links to resources that could make their work easier were also highlighted. We were worried about the receptiveness of the participants but were eventually amazed by their engagement and the innovative concepts about data harnessing they came up with for their various fields.

Breakout skill share session.

Breakout skill share session.


Strengthening the community.

Rounding up, we had a Google Student Ambassador from the University of Technology of Akure explain to the participants how to use the Google Drive collaboration tools. They learnt basic –intermediate skills of working with Google docs. So great! We now have a working group in the South-West of Nigeria with the NODA team to continue keeping the community vibrant.

Flattr this!

Data+Drinks : a meetup to engage the open data community in the South of Nigeria

- July 20, 2015 in Community, Data Blog, Data for CSOs, Fellowship

Data is now available online, but what next? This is the throbbing question on the mind of open data stakeholders, both from the supply and demand side of it.

landing 2
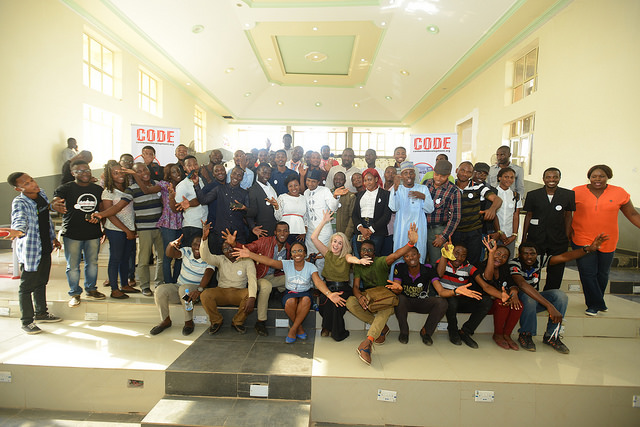
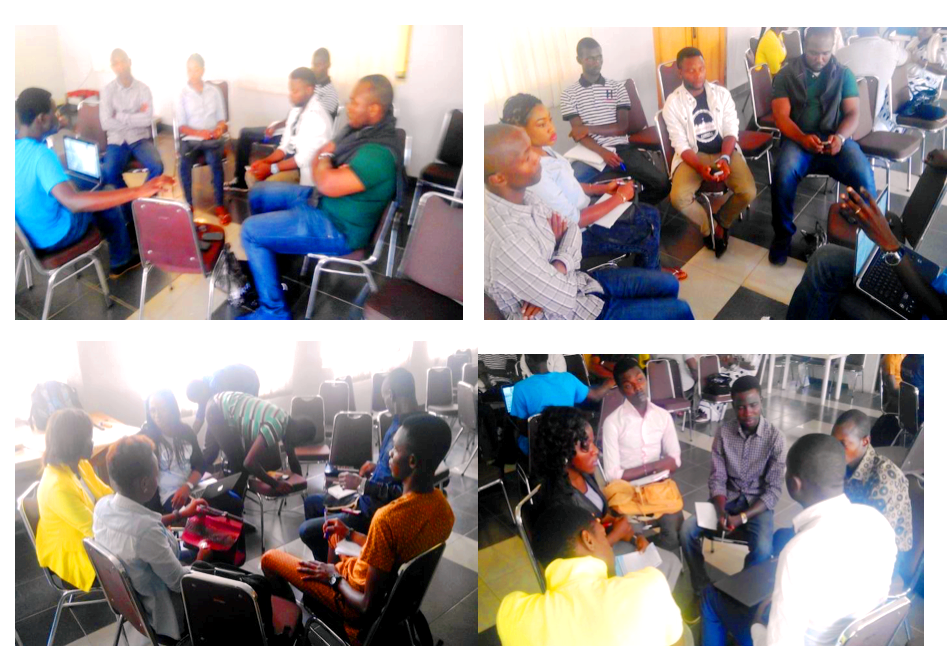
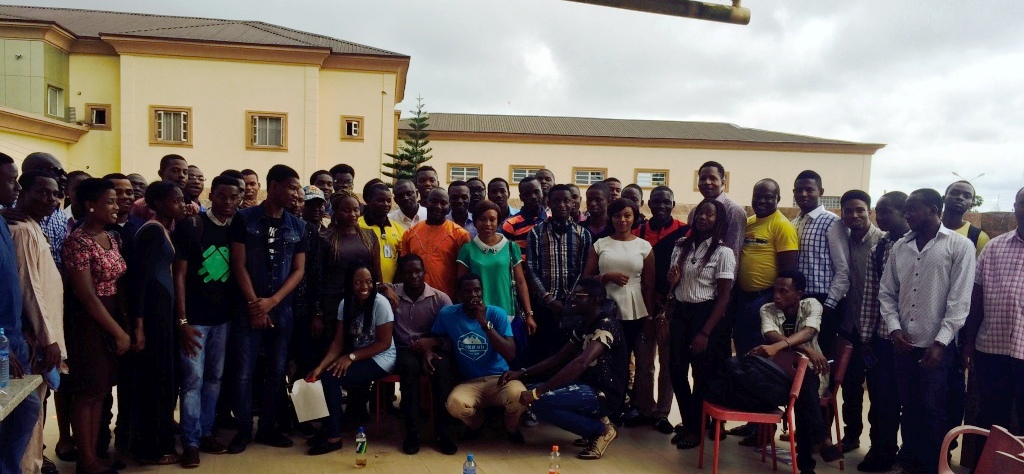
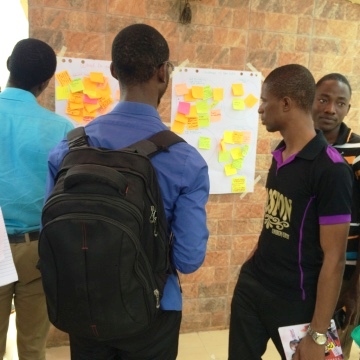
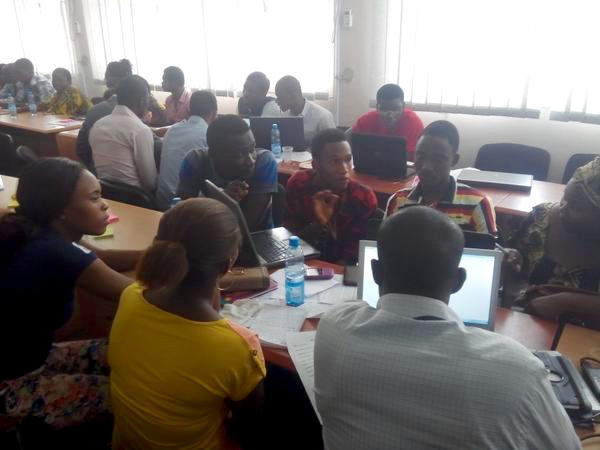
As the the fight for transparency and accountability in government keeps going with the help of open data, Nigerians are doing their share and innovating in that area. New initiatives around open data, open government, open education, open access… are appearing in Nigeria. But people are still used to the traditional ways of getting the  government to listen to the citizens : unions, town hall meetings, protests, etc.

How do we connect with citizens, civil society organisations (CSOs), journalists, NGOs and entrepreneurs and get them to take advantage of the available data? Monitoring the way the government works, driving advocacy, improving their activities and in turn the economy are all potential benefits of making use of the data, but the message still need to be spread. Thankfully, as a 2015 School of Data fellow, I can tap into the great School of Data community of people working on improving data literacy.

So what did we do? Simple : Our first step was to organize a data meetup. Called “Data + Drinks”, it was aimed at raising awareness, mapping new and existing open data initiatives and assessing the needs of the community. We invited individual citizens, Non Governmental Organizations (NGOs), journalists,  and entrepreneurs. They are interested in solving social problems in agriculture, education and other areas, using data in their advocacy and journalism.

‘Have you heard of open data? Come and let’s talk about it’

On the 27th of June, the day of the event the organisers were tense as it had started raining and this was our first awareness event with no prize or certificate (like our usual hackathons and trainings). This time it was merely an informal talk about open data and its benefits. Yet, the enthusiasm and participation were impressive, as 56 people braved the rain to attend. Among them, 23% were CSOs and NGOs, 48% entrepreneurs and students, 5% Government representative and 2% journalists.

Members of the CSOs
Members of the CSO

While 60% of them had heard of Open data, the 40% left had never heard of it. A few of them just walked into the event by pure curiosity: ‘what is this open data is about, is it a project or a tool?’

One of the participants, a well-known regional activist, wondered:

Why all the investment in collection and releasing of data and how does it affect me as an individual or change all the fundamental issues we have in Nigeria?”

As an answer to that question and many others, we took them through the journey of what open data is and its benefits to their various activity using both international and local success stories.


Mapping their interests and challenges

Participants documenting their interests and challenges.

Participants documenting their interests and challenges.

Of course stick-ons where involved! The participants documented their area of interest, their experience with data and the challenges they are facing working with it. They were generally more interested in how open data can help advocacy activities, improve the educational sector, help farmers and journalism. Many of them were unaware of the places where they could find the data they need, so data sourcing and collection was a major challenge. Another issue was working with data: analysing, visualizing and making use of it.

These findings helped us understand the community better and will help us design more focused trainings and engagements in the future.

Looking forward!

So far so good! Now that we had a successful first strike at breaking the ice, future open data hangouts promise to be better. We are going to address the challenges they shared with us. We grouped the participants following their areas of interest and will continue to share useful resources with them. A Data expedition will be organised in August and an open data party will follow in November. All these events are aimed at building a data literate community in Nigeria.  See more at #dataplusdrinks.

Our appreciation goes to OD4D, School of data, Connected development, Sabi hub and all the participants for making this a reality!

Meeting the participants

  • Chart made with Piktochart

Flattr this!

‘Where has this been!?’ Open Data Day in Benin, Nigeria.

- May 15, 2015 in Community, Data for CSOs, Events, Fellowship

In the city of Benin, located in the Edo State of Nigeria, the 21st of February was a memorable day. At the occasion of the worldwide Open Data Day, the first ever open data hackathon of the city took place, alongside another event called Open Data party .

This event, organised by SabiHub, was supported by Open Knowledge, the Ministry of Agriculture and Edo Open Data.  The event focused on the agriculture sector, looking at the challenges and engaging citizens to imagine data driven solutions using the available Agriculture datasets from the state’s open data portal. 50 participants were expected but over 90 participants joined us: Civil society organisations, NGOs, journalism Students, government officials and other open data enthusiasts.

As we kickstarted the 6-hour long event, the place was buzzing with excitement. 6 facilitators guided the participants through an adventure about data around the world, wrangling and making sense of numbers. Participants welcomed the knowledge with frowns, questions, excitement, and ‘where has this been’s!

ayotraining


Lunch and tea break were welcomed to calm the minds. We then introduced them to a list of challenges the agriculture sector was facing, and asked them to wrangle and create data-driven solutions with those challenges in mind. They broke out into groups and hacked for 3 hours.

What was the outcome? Many ideas sprung up, from bridging the information gap between famers and the market, to easier location of agricultural facilities and more. A common challenge in the groups was the lack of data skills to solve the problems idendified! Read more at #ODDBenin15

groups

Although Edo state is the first government in Nigeria to launch an open data portal since 2013, low data literacy among potential reusers is still a problem that keeps the initiative from reaching its full potential. The economic benefits of Open data has yet to be harnessed. The Edo State joined forces with organizations like BudgIT, Connected development in spreading the skills necessary to visualize government budget, track government spending and train civil society organisations and journalists while also evangelizing the use of data in schools.

With a population of over 170 millions, more has to be done to reach out to CSOs, entrepreneurs, NGOs, journalists. This work will be done thanks to School of Data and other organizations who continuously support the campaign for data literacy, active citizen engagement, fact-driven stories and advocacy, job creation and a lot more. We are not where we want to be, but things have definitely improved in the past years. I’m optimistic that the 2015 School of Data fellowship will drive us steps ahead towards a more literate and informed society.

Flattr this!

May we Fetch you Some Data Skills? Exactly, at the Open Data Day in Abuja

- March 8, 2015 in Events

While everyone else whines about more training time for tools to can improve their data skills at our last open data party in Abuja, we did something about it at the Open Data Day in Abuja, on Saturday, February 21, 2015: 2 hours, 10 skill shares, 10 facilitators, 72 registered participants, and view the screenshot below to read what some of our participants said at the end of the event.

sayings_oddabuja15

Tagged a skill share day that kicked off at 11a.m. it could not have been a wrong day to chose for this event, as 30 minutes before start of event, power was interrupted, and to make it worse, some part of the facility was going through renovation, Nevertheless, it began with an insanely charming activist from Devnovate/ Social Good Nigeria, Esther Agbarakwe, handing each of the participants a list of what to expect, and how the minutes are going to roll by in a flash – 2 hours will soon be over!

Surprisingly, the participants remain excited as we chose the first five skill shares that will run for the first hour (in a world cafe system). No thanks to our facilitators, who quickly had their laptops to run for next one hour without power. The skill shares for the hour were – Data Analysis using Excel Spreadsheet, Data Coding, using Google Spreadsheet for collaboration, Facilitation Skills and Community Building Skills. “It was quite intriguing to learn some simple skills around analysis with excel, been having headache around this all this while until this 15 minutes session” said one of the participants.

IMAG2220

While the heat of the sun started settling in, it was quite obvious that the every 15 minutes change to another skill share for the participants became an exercise that will soon be gone. A new set of skill shares were introduced after 1 hour 15 minutes. “How come we already run through an hour and 15 minutes, that was in a dash” exclaimed Oladotun Fadeyiye. New skill shares included using infographics, using twitter for good, funding mechanisms, using ArCGIS for mapping, creating great blogging website.

IMAG2231

Yusuf Suleiman taking on ARCGIS for mapping


Two hours fifteen minutes went by, and we were impressed at some of the ingenious ways our facilitators came up with, to teach without power! Did BRCK come to the rescue? No, not yet, it was a short time, so we got all laptops fully charged, so that by the time we finished, all laptops battery would be beeping. Internet came from shared sticks, and also I saw a facilitator using practically online screen shots for demonstration, making look like he was browsing – how intelligent!

As it was a short time, participants were instructed to scribble their questions on sticky notes, to be read at plenary, after the “party’ was over. We had questions like why is it important to code data, how can a stammer facilitate, how secured is it to share files with Google Doc, Can I use the Google Drive if I do not have a Gmail account. Had suggestions like can we more time for the skill share next time – like dedicating one hour to a particular topic, thus taking us to the advanced skills.

IMAG2235

School of Data stickers up for grabs in a Thank you format to all Participants


At the end of the event, despite the fact that I had to fix laptops battery that were running out, collect sticky notes, shared sweeties and stickers, make sure sugar and energy drinks were available, tried blowing out the heat from participants sweat, Little said I would make a great concierge. We kept our cool and bantered with participants, and have useful connections, admittedly largely at getting feed backs. When it is time for another data skill share, I will be prepared to serve. My first question is going to be whether participants miss their homes during the skill share hours ;)

Flattr this!

Catch us if you Can: The #OpenData party moves to Calabar!

- October 28, 2014 in Events

So what’s the fuss about this #Opendata party in the South South of Nigeria – It will be held in one of the cleanest city in AfricaCalabar, and will be hosted in a state that has the most comforting tourist attraction in West Africa – the Obudu Mountain Resort! If you think there is another like it in the region, please comment below ;) and one other thing about Calabar is the attributes to their women, and just for clarification – Calabar remains the capital city of Cross River State.

Right on time at the popular Mirage Hotel on October 15, 2014 was the Open data party that had 15 participants from different NGOs, citizens and this time we had some government officials – thus making it interesting. Whenever you have these three groups locked on a round table – questions like: why didn’t you make the data available, why didn’t  you reply our FOIA, didn’t we make funding available for you to monitor, what happened to all the international aid you get, all come up, and as a facilitator – you are lost!

Break out session at the Open Data Party in Calabar

Break out session at the Open Data Party in Calabar

With my experience teaching data with NGOs, journalists and citizens, it is still clear that few of the practitioners know where even the little data available is hidden online. “It is appalling that we all here don’t know where the federal government budget is being published” affirmed Onoche Mokwunye. I get this answer often in all my sessions, which makes us conclude at times that the simple skill of finding data (secondary) itself and what their interest was in data, remains important.

In trying to figure out what kind of data they were interested in 40% of the participants were interested in budget data of the country; 30% were interested in contract data  (in essence, the issue of money, and how it’s been used is important), while the remaining 30% was shared amongst election data, environmental data, infrastructure data, and transport data (which seems not to be available). Going forward did they really know where to find this data? KNOW! Well, it will be important to state that the Nigerian government has recently focused on some open data initiatives, even though it is not as if these portals make data available in machine readable format.

See what kind of data our participants were interested in

See what kind of data our participants were interested in

One may think, since we wouldn’t know where to find, or how to get the data, analyzing data might be a great challenge, of course NO! This group had great knowledge of diving into excel spreadsheets – maybe I knew only one way of handling some task before, now I learnt two more ways – that was the most interesting part of this data party! So what else, how do we present this datasets using several visualizations and infographic. “I have seen several colourful visualizations (online) that people in our communities cannot relate with, as such we still need to break it down in the language they will understand (offline) – maybe that’s an added task for us” explained Benny from AfterSchool Peer Mentoring Project

Just before the end of the sessions, participants already concluded to have another 2-day Open Data Party,, while they declared having step down training in their own communities. When our Open Data party ends within 8 hours, participants are at times heartbroken! “Are we going to continue tomorrow, I seem to be an information and skill overload in a short time” – mentioned Ndoma Mayor in a phone call with me. Truly, does our party end in 8 hours? What happens to the” party” behind Open data – we always rock the club, after all, we are in Calabar, where the female become goddess at night! And if you want to know where our next open data party will be happening: most definitely – Abuja, No thanks to Connected Development [CODE] and Indigo Trust UK

Flattr this!