Proving the Data – A Quick Guide to Mapping England and Wales Local Elections
If the role of news journalists is in part to hold the powers that be to account, whose role is to make sure that claimed releases of public open data are fit for purpose, or that appropriately licensed data is available for civic public use?
With local elections coming round again in the UK (Full Fact provide a good overview of what’a going on: Local elections: the who, what and why), we have an opportunity to put some of the open data released by UK local and county council elections to a practical test. THis post will focus in particular on geographical data, which means we can also have some fun learning how to make maps…
Your mission, should you choose to accept it, is to poke around a UK county council website (and maybe a local council website too) to see if they provide the data to make it easy to generate maps of that area. This data could then be used as the basis not just for reports on a local election, but also potentially for other civic use cases. Whilst much of the data may also be available via national datasets, many users of civic data in particular are more likely to be interested in data at a local level. Moreover, these users won’t necessarily have the tools, or the skills, required to download and process sometimes quite large datasets in order to extract just the local data of interest. Which is why we need to prove them at a local level.
So here are a few quick recipes for generating maps around some of the election data using open data and a variety of free tools we can find scattered around the web.
We’ll look at a couple of things in particular:
- create your own polling station map from a KML source file of location markers;
- create your own boundary line map of electoral wards or divisions using a boundary line data.
The sorts of maps we’ll generate are of two kinds. The first is just to plot markers onto a map. This approach can be ideal for plotting the location of polling stations, for example. Markers also provide the basis for proportional symbol maps, where the area of a symbol (such as a circle) plotted at a particular point (such as the centroid, or “middle point” of the electoral area) is used signify a numerical quantity, such as some function of the size of the majority, for example. The second is to plot boundary lines, such as the boundaries of local wards for unitary authority councils, or the larger electoral wards used for county council elections, to mark out the different population areas that are used to elect each representative. This boundary lines mark out areas that can be coloured, for example according to the party that won the corresponding seat, or maybe the swing in the vote of the winner compared to the previous election.
Create Your Own Polling Station Map from a Source File
The first example we’ll consider is how easy it is to generate a map of polling station locations. A web search for uk polling station location data or polling station uk council election turns up some candidates, several of which appear to be linked to from data.gov.uk, the UK’s central public open data registry as KML formatted files. When looking for location data, KML is a “Good Thing” to find because KML is standardised document format for publishing geographical data. So let’s see what we can do with it…
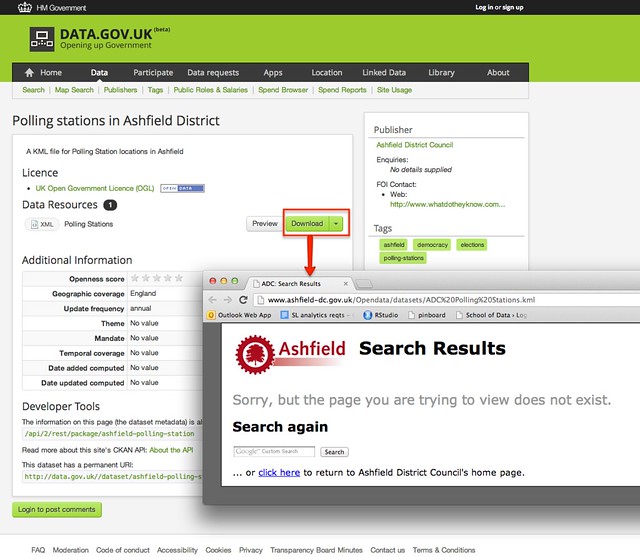
Or not as the case may be. (So how do I flag this download link as broken? On the data.gov.uk site? Or should I try to contact someone at the council directly?!)
Rooting around the corresponding council website, it seems as if they’ve been having a redesign, and decided to publish the locations of the polling stations this time around in a PDF file.
Let’s go back to the web and search a little more; it seems the Lichfield Council website has a KML file of polling stations dating back to 2010 – http://www2.lichfielddc.gov.uk/geo/polling.kml – so let’s see what we can do with it… If you go to Google Maps, and paste the URL of the KML file into the search box, and then hit return, you should find that the file is loaded into Google Maps and the location data it contains plotted on to the map:
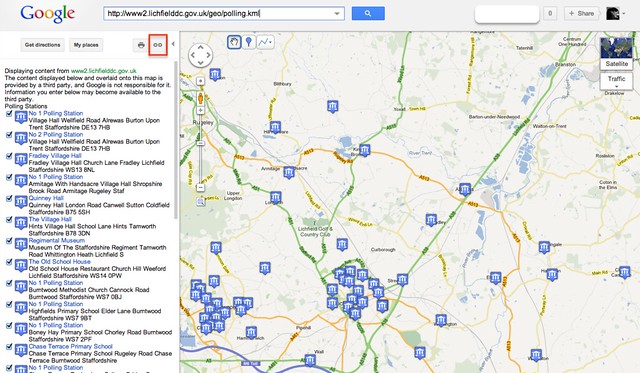
If you click on the link icon, you can grab a URL that points to that map, with the data plotted onto it, or an embed code that lets you embed that map in your own web page, subject to Google’s terms and conditions! (I haven’t found a reliable previewer for viewing KML data over OpenStreetMap?) Which could be useful?
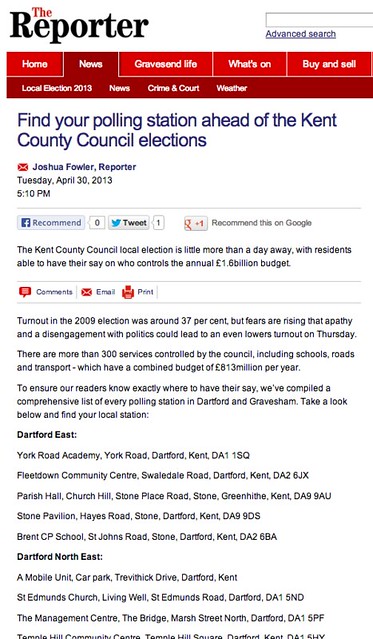
It seems to be a rare council that actually publishes the location data as such, though. More likely, the data will be locked up (as we have seen) as an address – or even a printed map – in a PDF file. Some local news outlets at least manage to get the data onto a web page, but can we do better?
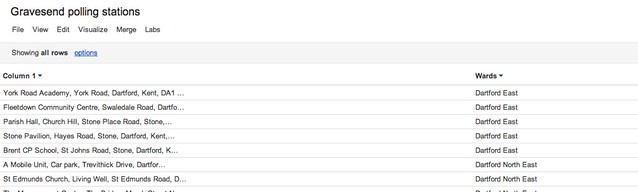
I’ve posted a recipe elsewhere (A Simple OpenRefine Example – Tidying Cut’n’Paste Data from a Web Page) that describes how we can use a tool call OpenRefine to tidy up the address data a bit to get it to look like this (at least, when the data’s viewed in a table layout rather than as raw CSV;-):
Having got the data into a nice, tidy form, we can now import it into an application that can geocode the addresses; that is, that can find the latitude and longitude for the the locations represented by the addresses. I haven’t used Google’s new Maps Engine Lite yet, but I believe it can accept CSV files as long as one of the columns contains geocodable data, such as an address…
Let’s create a new map:
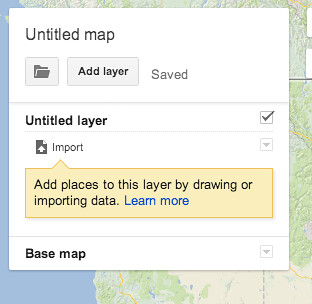
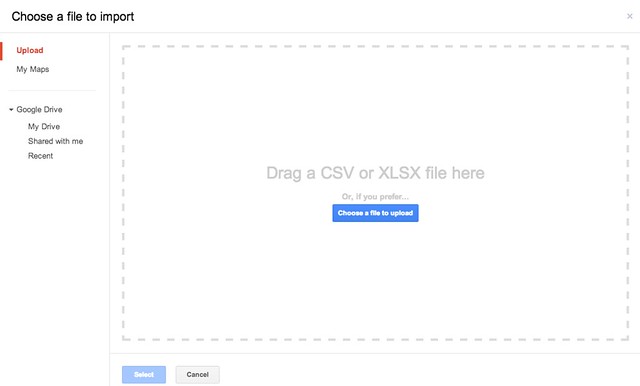
Clicking on the upload link means we can upload some data:
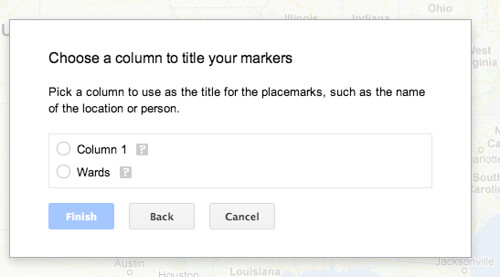
The Maps Engine fully expects some location related data that ist can set it’s geocoder on to, so what column contains the address data?
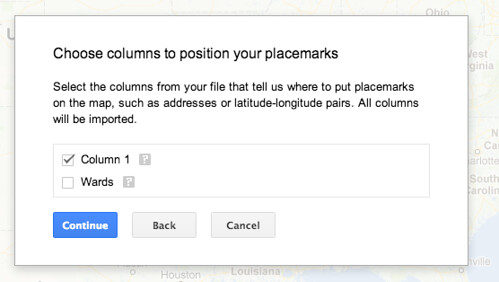
We should also provide a meaningful label for each address marker (though this data set doesn’t really have that…)
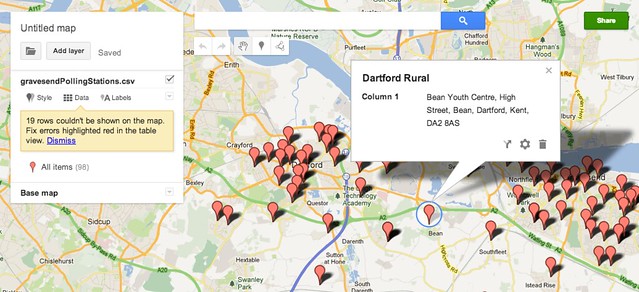
Any locations the geocoder has a problems with are identified – click on the Data link to pop open a data table view that highlights the problematic rows:
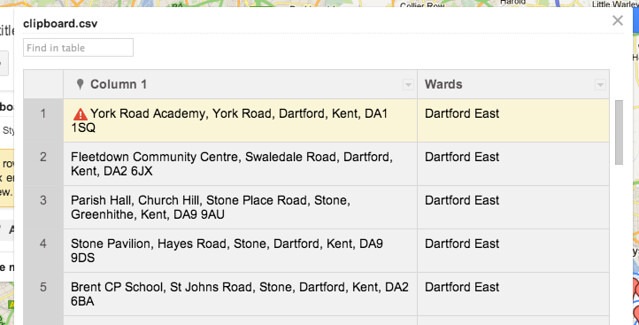
If you double click in a cell, it becomes editable…
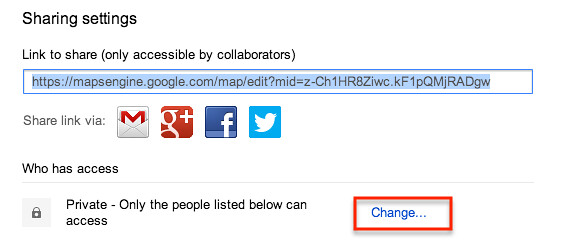
To share your own map, click on the green Share button in the top right hand corner and then change the privacy setting…
Note: there are other ways we could geocode this data. Simple Map Making With Google Fusion Tables describes how to do it with Google Fusion Tables, and Geocoding Using the Google Maps Geocoder via OpenRefine, but again the co-ordinate data will be subject to Google license conditions. Check out the School of Data blog thread on geocoding to find some open alternatives.
Create Your Own Boundary Line Map from a Source File
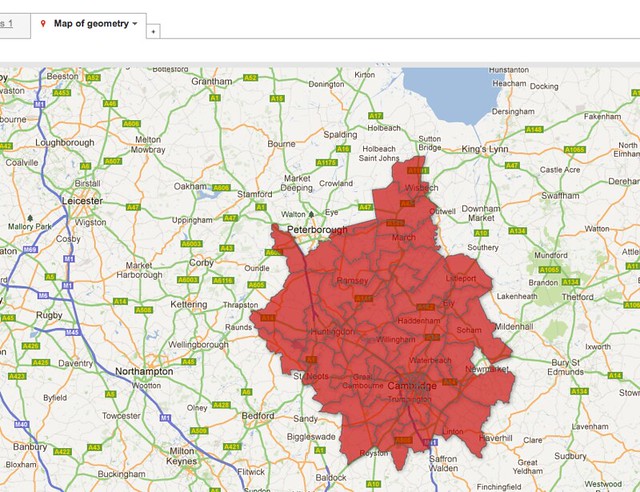
As well as mapping polling stations, we could also try to map out the different electoral wards that are covered by a particular council area, to give us a map that looks something like this for example:
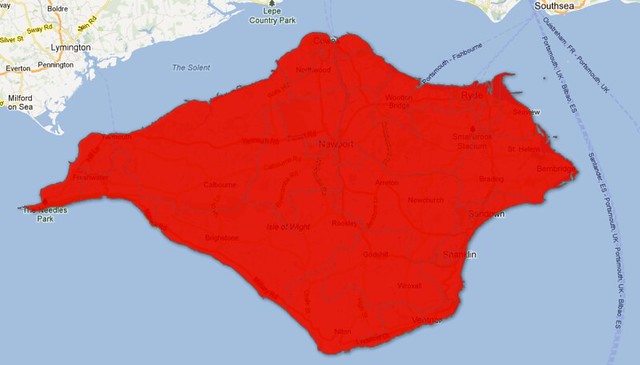
Can you see the boundary lines marking out the wards in there?
Once we have boundary lines associated with areas, it’s possible to colour each area according to some other paramater. In the case of an election, this might ne a colour representative of the party that took the seat, for example. (As to how to actually do that, that’ll have to be the subject of another post!)
SO where can we find boundary line data? A quick search on the Cambridgeshire County Council website turns up a possible source for that area:
Let’s see what happens if we take the URL for the County Council electoral divisions KML file and paste it into the Google Maps search box:
http://data.cambridgeshire.gov.uk/data/democracy/cambridgeshire-county-ward-boundaries/ElectoralDivisions.kml
Can you see the black boundary lines marked on the map? Unfortunately, the areas donlt appear to be labelled (the listing down the left hand side is blank), but at least there’s something there.
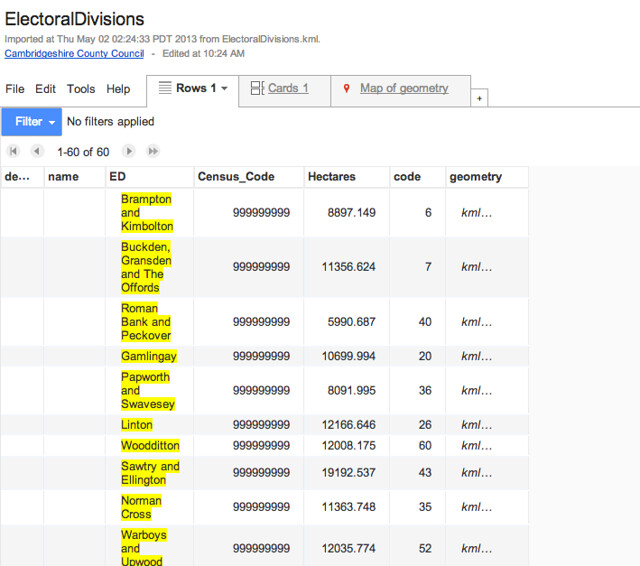
To actually work with the data, we can load it into Google FUsion Tables. Download the KML file, save it with a .kml suffix, and then import it into Google Fusion Tables. From GOogle Drive, select a new Fusion Table:
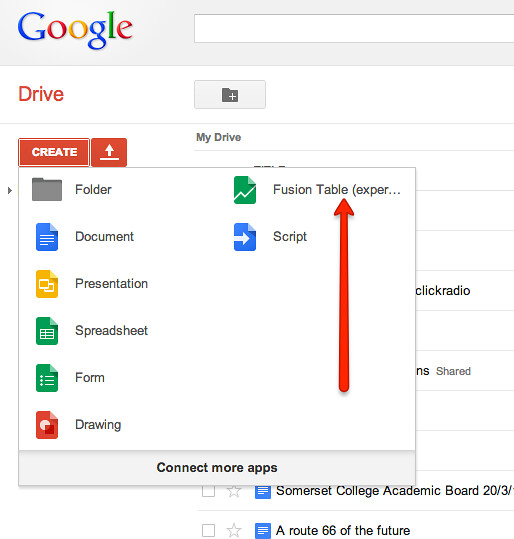
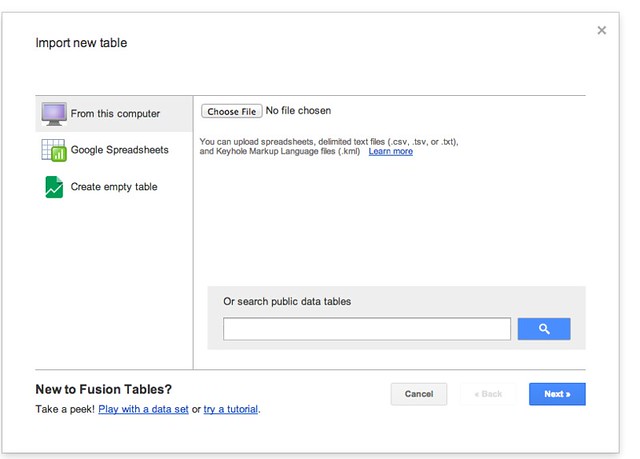
and then import the KML file:
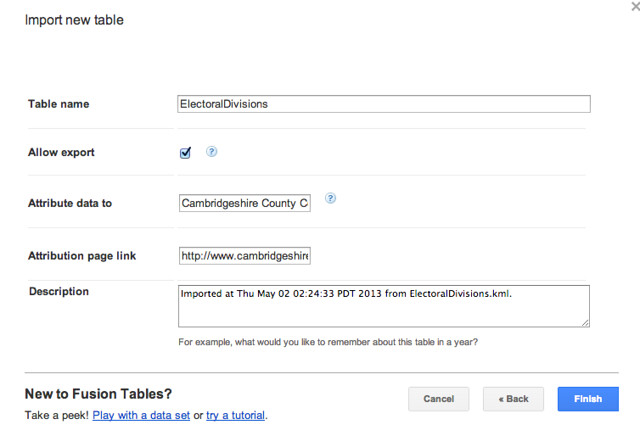
Don’t forget to add provenance information:
Once the data is loaded, we should see the “geometry” column has been recognised as KML data. The yellow column also shows that FUsion Tables has recgnised that column as a location type too (though we can also change it to just a text column).
Here’s how the map looks:
To make the map shareable, we need to go to the Share button (top right hand corner of the window):
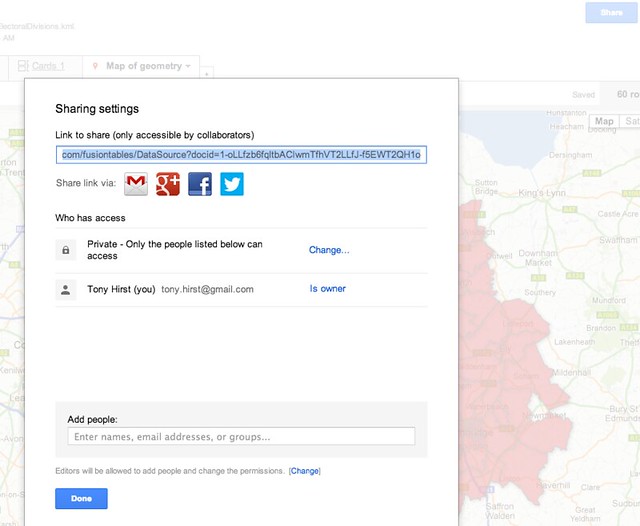
and select something suitably public:
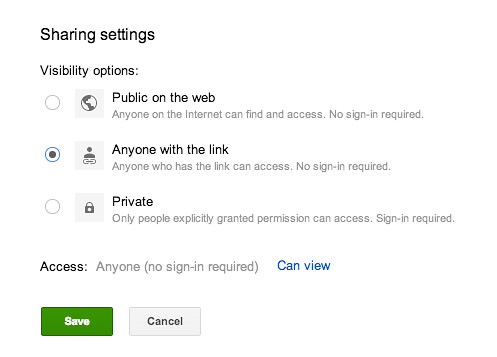
If you want to see the map, here it is.
If you need a more powerful mapping tool with which to work with the KML file, QGis is a good place to start…
If you struggle to find shapefiles on your local council website, this recipe might help: Boundary Files for Electoral Wards Covered by a Particular Geography
Summary
This has been a quick tour of how to start proving some of the open public geo-data that councils may be making available. If they aren’t, or if they are and there are problems with it, maybe you should let then know?
![]()