Mapping the Well-Being of Children in the District of Columbia
Last year, DC Action for Children, in partnership with DataKind and a group of dedicated pro-bono data scientists, created an interactive, web-based tool to take traditional child well-being indicators “beyond the PDF book” and into the exciting realm of visualizing and communicating data for collective action.
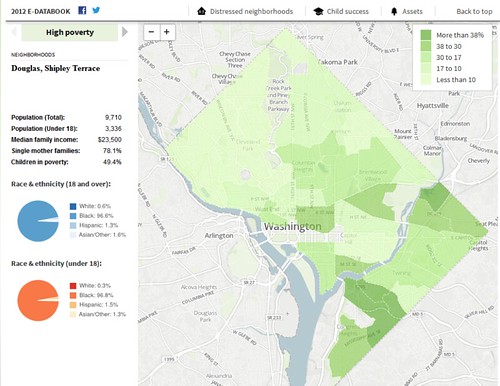
The neighborhood maps we created showed that the success of too many DC (District of Columbia, U.S.) children is predetermined by their ZIP Code – and limited access to critical resources to thrive. Some DC neighborhoods have assets that enrich the lives of children, but others are characterized by high levels of poverty and the many challenges that come with it, including poorer performing schools, more violent crime and less access to resources like healthy food, libraries, parks and recreation centers.
For the project we used both U.S. Census Bureau and local administrative data about the population and resources in District of Columbia neighborhoods. We obtained data on population counts and social characteristics from the Decennial Census and American Community Survey. Geographical data, shapefiles for mapping, and data on community characteristics such as grocery stores, libraries, crime and transportation were obtained from the DC Data Catalog. Other data were obtained directly from local agencies, including the DC Office of the State Superintendent of Education and the DC Department of Health.
To obtain the neighborhood-level estimates, our data scientists used block-level population data to construct population weights for data at the block-group and neighborhood level. The DC Master Address Repository was used to geocode point data, such as locations of libraries or schools; ArcGIS was used to aggregate point data by neighborhood. Collaborators used MapBox to create neighborhood maps.
Community response
The response to our newly launched KIDS COUNT 1.0 has been overwhelming, both locally and nationally. Local policy makers have been relying heavily on the work and asking what is next, particularly how to add data that can start to bring accountability to public policy decisions and publicly funded programs.
The work has also been recognized as innovative by numerous organizations, including the Annie E. Casey Foundation (through the KIDS COUNT network), Rockefeller Foundation (Innovators Award) and Global Editors Network (2013 Data Journalism Awards). We continue to get inquiries from potential partners like The World Bank, the White House, and, most critically, parent groups.
Why is this important?
In a city where policy decisions that determine the allocation of resources and assets are guided by relationships and old-school politics, the project will bring much-needed transparency to DC government budget data. We must show how budget decisions align or do not align with the needs of our children.
In DC, there are approximately 100,000 children under 18 years of age. More than 36,000 young children are growing up in DC neighborhoods – playing on city playgrounds, attending child care centers and preparing for school in pre-kindergarten classes. The number of young children in DC has increased by 11% since 2000, which is especially notable because the total number of children (under age 18) has decreased by 8% over the same time period. With a rising birth rate and expanding overall city population, we expect the number of young children to continue to increase in future years. Of the 36,000 – 1 in 3 live in poverty in DC. Poverty is pervasive.
DC has the highest spending per pupil in public education. We have had intense national scrutiny based on the efforts in education reform to improve outcomes for children, yet even with all the spending and reform efforts, the bottom line: outcomes for children are not improving.
Next steps
In the next phase of the project, we propose to add a layer of local budget data to the asset maps to answer a related question: If we map public investments, will they align with where we have mapped need among children in DC?
We propose to use five years of retrospective budget data to add a powerful new tool to our DC KIDS COUNT maps to help policy makers, media, advocates, service providers and citizens evaluate the city’s budget through the lens of young children – in the neighborhoods where they live. The project will help us present a more nuanced analysis of the geography of DC budget investments, including to:
- Map where the city has invested in the futures of young children and where it has not.
- Create a shared understanding of how investment maps do – or do not – match with need maps for the city’s children.
- Communicate messages about inequities in investments by geography and demographics (income, race, etc.).
- Identify budget and policy opportunities for addressing the identified mismatches, gaps and inequities.
Our ultimate goal is to ensure the data and analysis we provide will change the outcomes for children, youth and their families.
As I reflect on the success of this partnership and project, a few key themes surfaced:
- Leadership: Jake Porway (founder of DataKind) and Sisi Wei (project lead) were instrumental during the preliminary phase but also for long-term sustainability of the project. We all knew that this was new territory of data work. Both were committed to the answering our BIG question: “Can we change child outcomes with data?” There was definitely a theme among the three of us: innovative, risk-takers, visionary, do-gooders and a little too much enthusiasm about data!
- Data Heroes: A leader can’t lead without a strong troop. I recall being at the DataDive and praying that most of the genius data heroes would choose our project BUT there was some fierce competition. As one of our project data heroes often states, “I joined this collective effort to make a difference and wanted nothing in return.” But what we all got in return was the opportunity to engage in a magical process empowered by trust, mission and impact. We saw in action what Jake had always envisioned: data = social change!
![]()