The quest for air pollution data in Paris
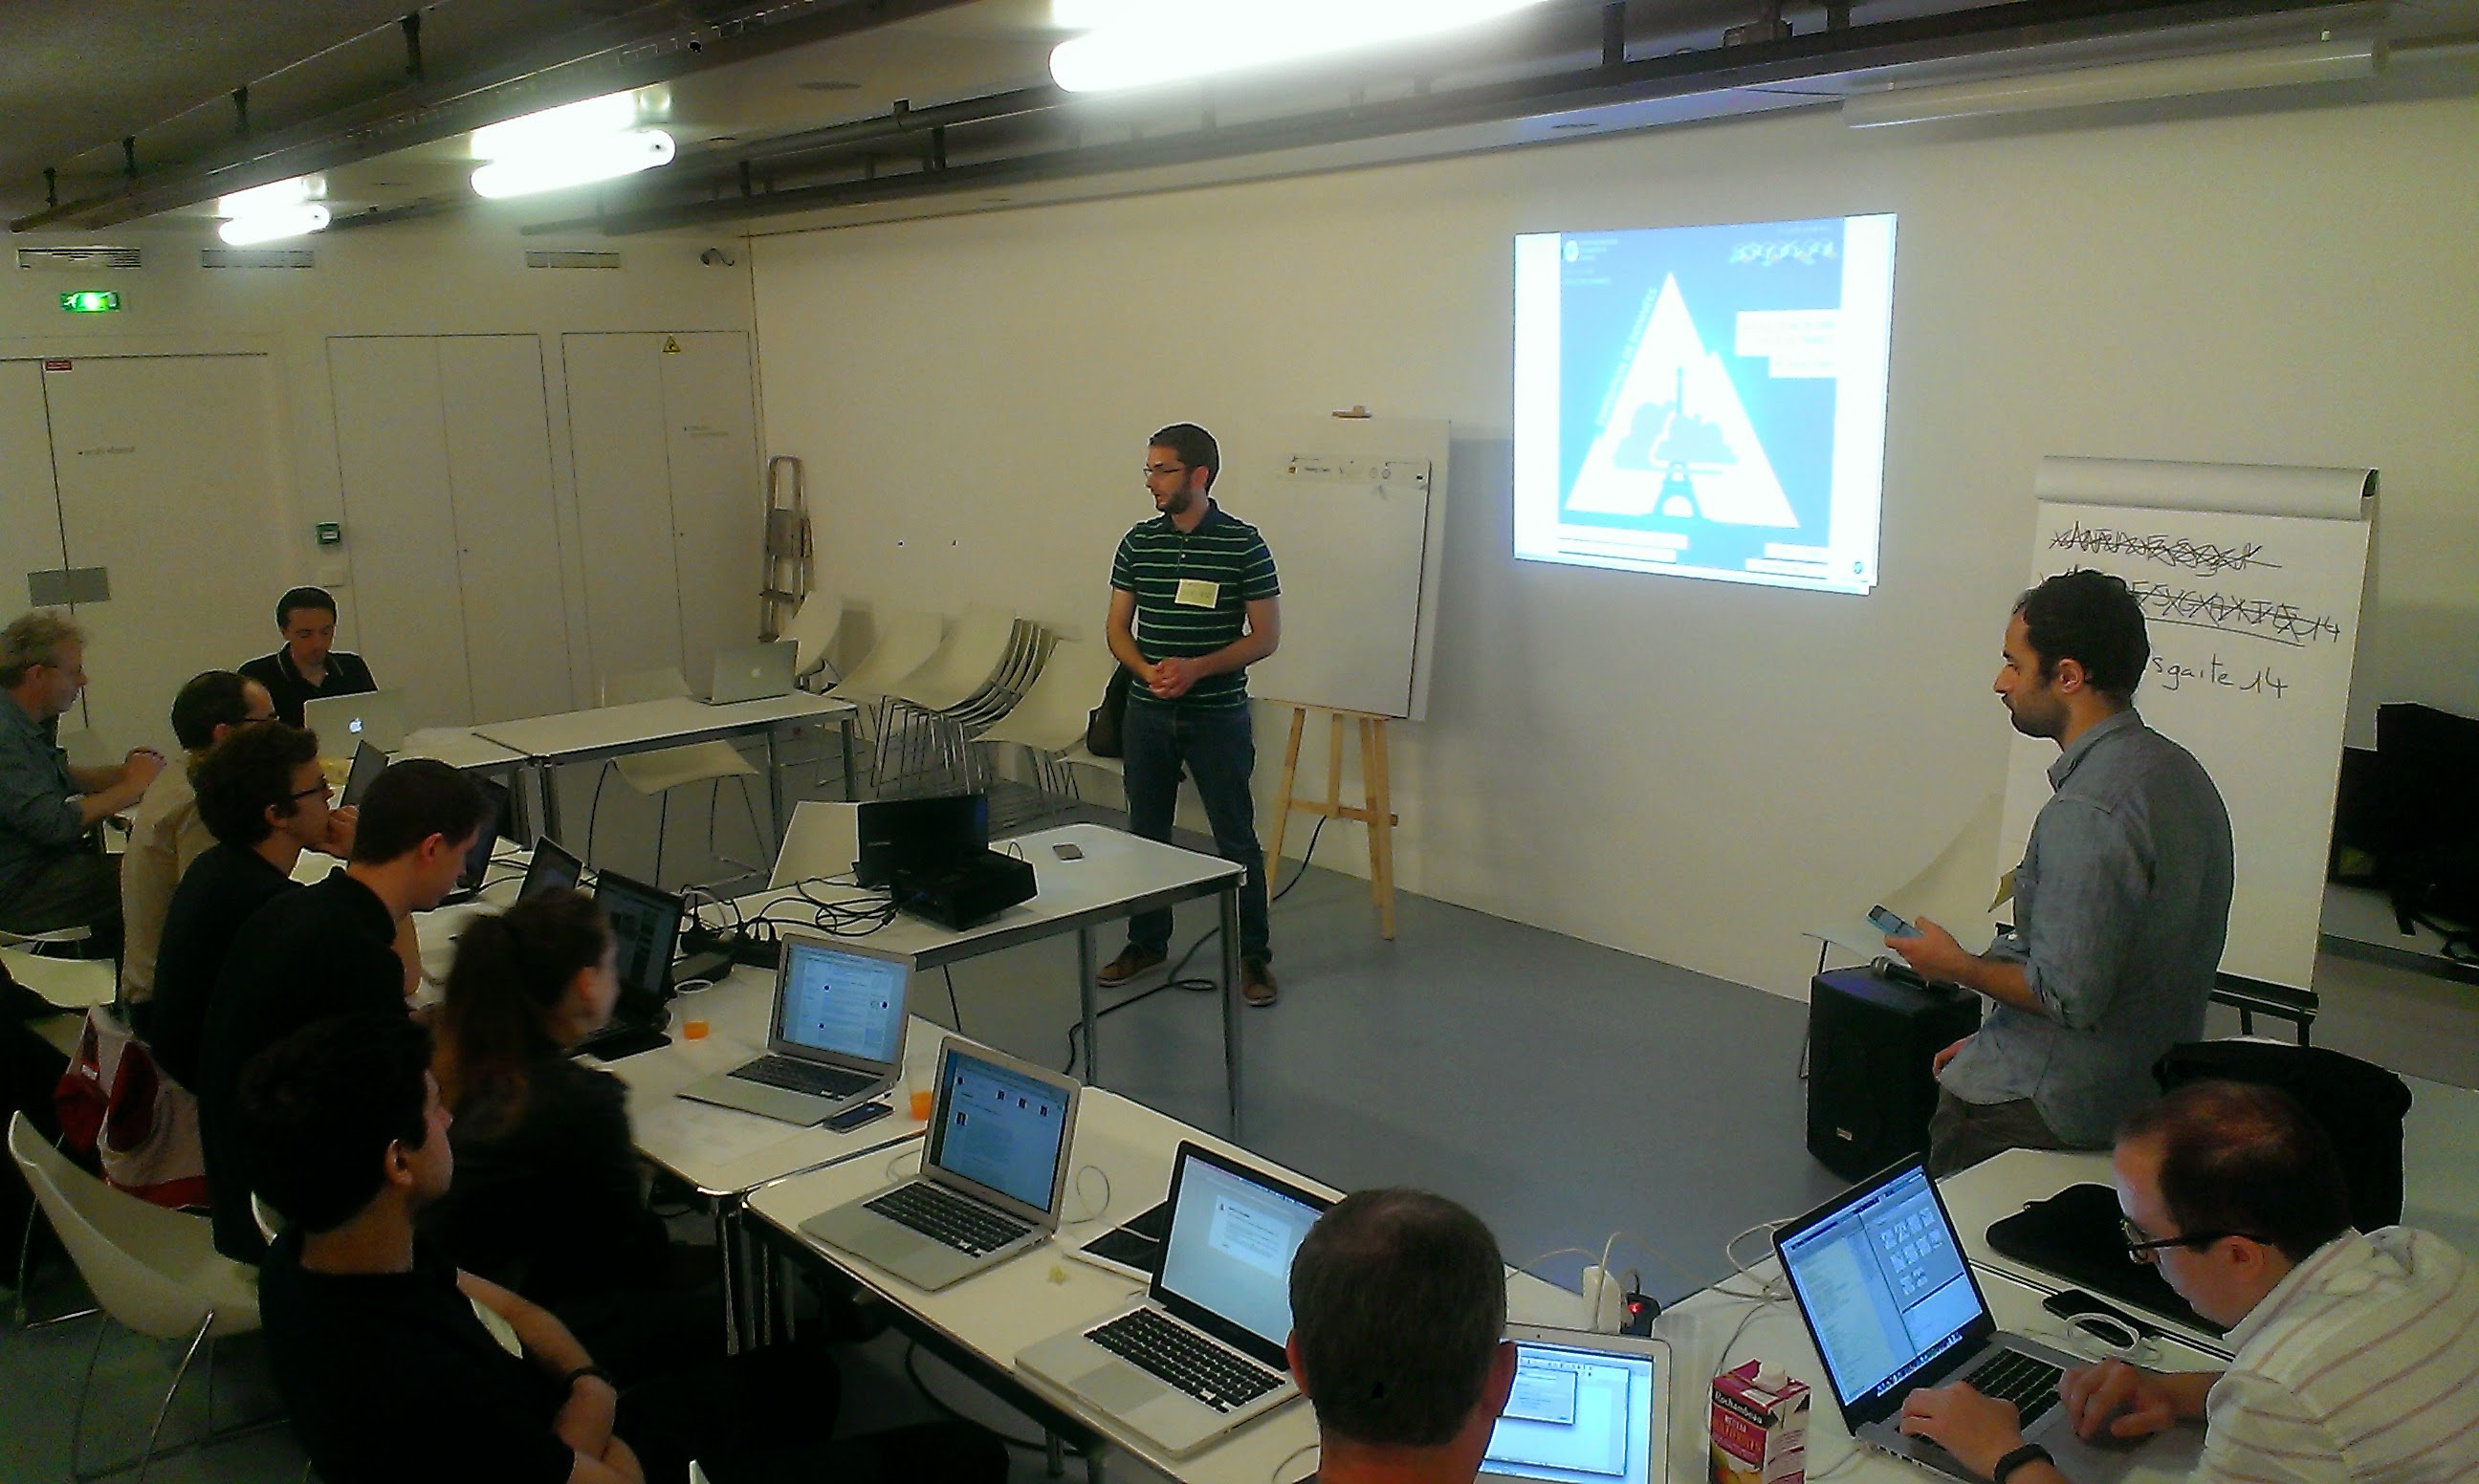
On June 15th 2014, during the Parisian digital festival Futur en Seine, the French Open Knowledge local group organized its first data expedition. Our theme was air pollution in Paris urban area. The expedition was hosted by the Infolab, a prog![]() ramme dedicated to data analysis for the general public.
ramme dedicated to data analysis for the general public.
Air pollution made sense as a theme to explore. The subject hit the news some months ago with a pic of pollution in Paris, and there were some obvious datasets we wanted to investigate. The workshop was successful on the whole, but not necessarily where we expected it to be. Air pollution in Paris urban area was definitely a complex subject to explore, and little if any related data was available.
14 The number of attendees
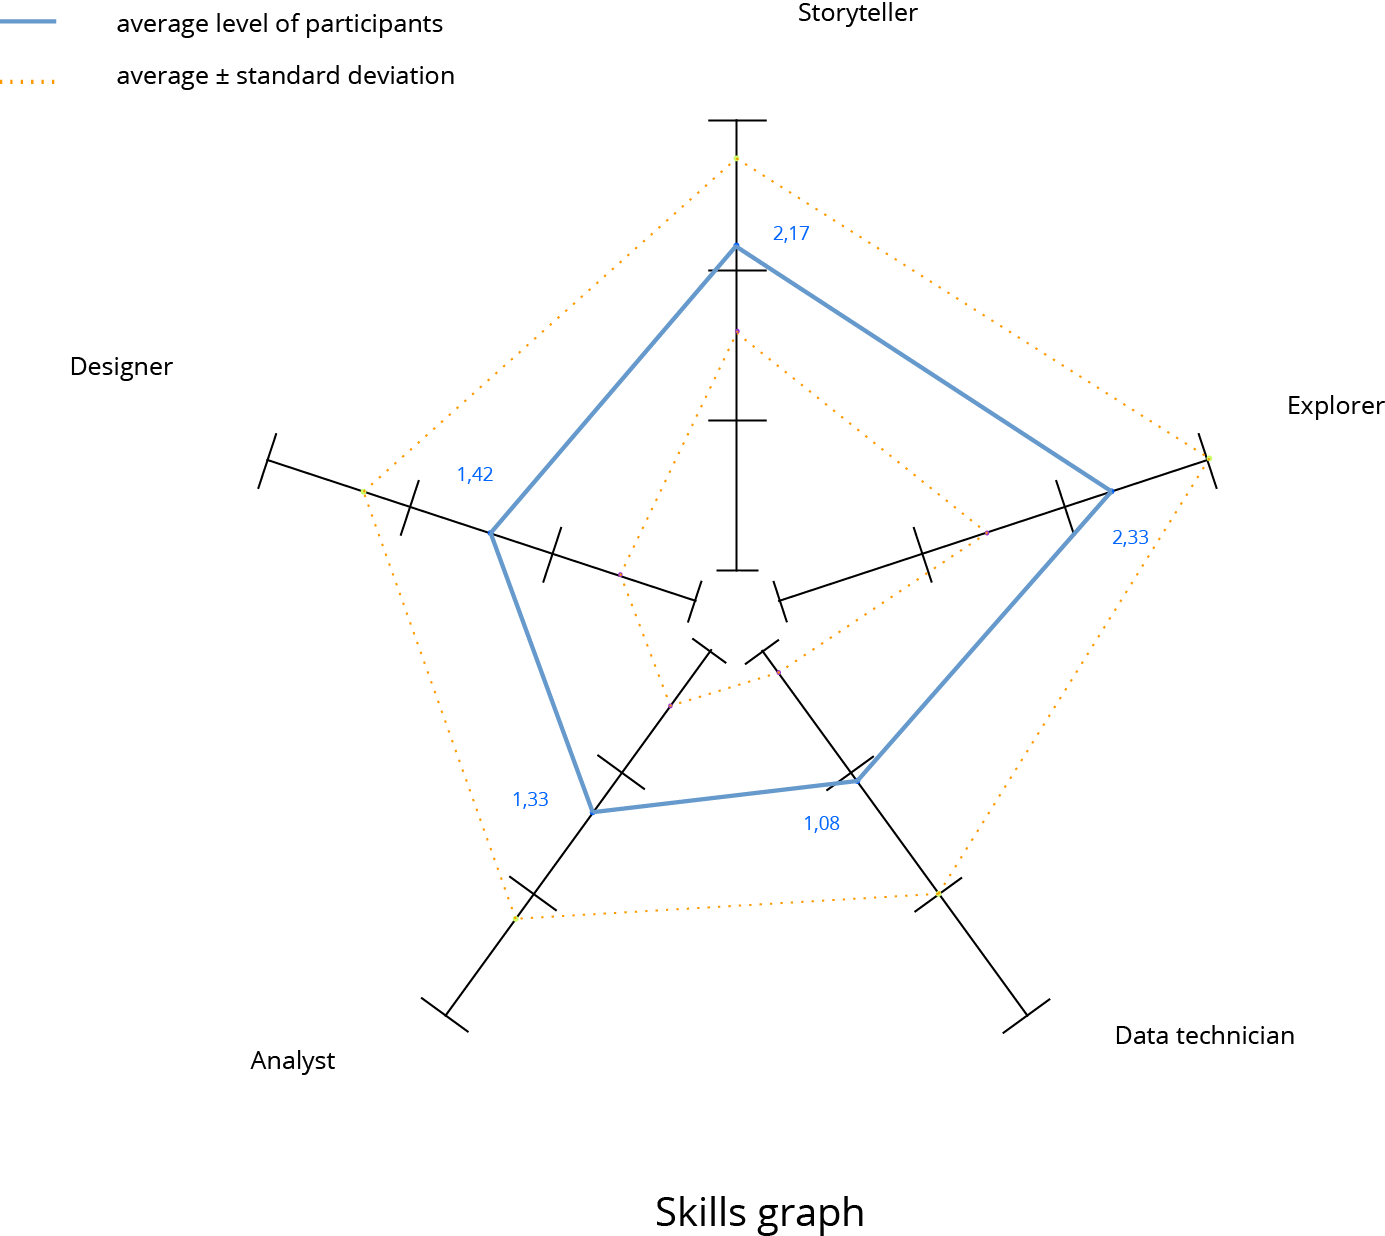
Attendees had to position themselves on a scale going from 0 to 3 regarding several competencies: Storyteller, Explorer, Data Technician, Analyst and Designer. A quick analysis showed that some competencies were unevenly distributed, with the exception of storytelling.
3 The number of approaches
After a brainstorming to find interesting questions about air pollution in Paris (first phase), five questions were selected. The participants then split in 3 groups with each choosing one question as a starting point for exploration.
-
Group 1 : Do public transport strikes have an impact on air quality?
-
Group 2 : Has the rise in bike use helped decrease the overall level of air pollution?
-
Group 3 : Is Paris different than other international capitals in terms of air pollution? And what is behind the difference?
Notably, the question about strikes came from an OKF Twitter follower, @fcharles
10 The number of data providers used
Airparif, data.gouv.fr, European Environment Agency… various data providers have been combed (second phase) to find useful data for the expedition. Among the 14 datasets found, the most useful were those from Airparif. They describe the evolution of the concentration of the 4 most important pollutants (SO2, NO2, O3, PM10). One group made a call for help on Twitter to find more data about Paris’ bike sharing service, which helped two important datasets to be opened to the public.
0 The number of significant correlations found
It looks like a low number, but no significant result does no mean no result at all. The subject was ambitious, and the data was often incomplete, or even unavailable for analysis (third part).
Group 1: this group studied the strike of the national railway company workers that occurred on June 11th 2014.
Hypothesis: by measuring the levels of pollution during and after the strike we can highlight the impact of the strike on air pollution.
Result: comparing the during and after didn’t yield significant results.
Group 2: this group tried to compare the evolution of bike use with the evolution of air pollutants concentration.
Hypothesis: some of the people who bike to work choose this transport solution over their car, meaning that they contribute to a reduction in air pollution.
Difficulty encountered: the raw data of Airparif was complex to manipulate, which kept the group from finishing their analysis in time.
Group 3: this group decided to create a dataset from scratch with geographic, demographic, transport and pollution data regarding several world capitals.
Hypothesis: by comparing enough variables, we can observe which characteristics are linked to air pollution.
Result: Even visualised in a bubble chart, no obvious trend was found
5 The number of data set created, improved or made public
| From | Datasets | Sources |
| Group 2 | Monthly variation of Parisian bike traffic since 2008 | Observatoire des déplacements à Paris |
| Group 2 | Geolocalised data from Airparif’s pollution sensors regarding the 4 main pollutants (this data can’t be reshared) | Airparif |
| Group 3 | Geographic, demographic, transport and pollution data for Paris, London, Berlin, Madrid, Brussels, Copenhagen, Amsterdam | Earth Policy Institute Agence européenne de l’environnement Commission européenne Air Quality Index Eurostat |
| Etienne Côme | Historical data of 20 bike sharing services from several cities in Belgium, France, Japan, Norway, Slovenia, Spain, Sweden | http://vlsstats.ifsttar.fr/rawdata/ (fr) |
| Mathieu Arnold | Historical data of the usage of Paris bike sharing service’s parking stations. Updated every 10 minutes since 2008 | http://v.mat.cc/ (fr) |
Sadly, Airparif’s licence does not grant the right to share their data. This is surely something that should be investigated considering the status of Airparif, an association whose mission of providing pollution info is a public service under delegation of the French Government.
Some other numbers :
| 0 | The number of data used that were really in open data. The data retrieved was either in PDF format, or wasn’t under a open data compatible licence. |
| 15 | The approximate number of hours spent studying air pollution to prepare the expedition. |
| 5 | The number of software tools used: LibreOffice, Google Spreadsheets, R, Google Charts, Open Data Soft |
| 270 | The duration of the event in minutes. From 11h30 to 16h00 |
![]()