Module Objectives:
- Understand what kinds of IATI data are online
-
Discover where to find the IATI data itself
-
Understand where to find metadata on IATI data online
Prerequisites/before you get started:
-
Complete Introduction to Aid Data
-
Read An Introduction to IATI from the IATI website
Table of Contents:
-
Introduction
-
Background
-
Sources of IATI data
-
A walkthrough of the IATI Registry
-
A walkthrough of the IATI Datastore Query Builder
-
Sources of data about IATI data (metadata!)
-
Further Resources
Introduction
We’ve already looked at what kind of aid data can be found online. As we mentioned, one big source of data on this topic is made available through the International Aid Transparency Initiative (IATI). There are a few different ways that you can access raw IATI data, so here’s a quick run through of what you can get, and where it is.
In this initial guide, we’ve just included sources of raw IATI data, not applications that are built using IATI data. To see some of those, check out the Tools tagged with ‘IATI’ from the Open Development Toolkit site.
Background
Before we begin, a few terms and concepts about IATI that are useful (though not essential) to understand as background:
The International Aid Transparency Initiative (IATI – normally pronounced as a full word, ‘aye-at-ee’) is an initiative aimed at increasing aid transparency, which encourages organisations to put data about their aid activities online. Where they are spending their money, what they are spending their money on – the aim is to make it as easy as possible to ‘follow the money’.
Aid data is important because without it, it is very difficult for all parties involved in the sector to plan their work, to know whether it is being used as intended, and to know how effective it is. The overarching aim of IATI is stated as seeking to “improve transparency of aid, development, and humanitarian resources in order to increase their effectiveness in tackling poverty.”
There are so many groups working in this space: donor governments, big donor agencies like different UN groups, private donors like the Gates Foundation… the list goes on. Not having good quality, easy-to-access data on this topic makes things difficult for everyone involved. Donors can’t keep track of where their money is going, and those in aid-recipient countries can’t keep track of what should be happening as a result of development projects.
It’s run by a multi-stakeholder group in the Secretariat, but this sits within a wider governance structure, which organises itself as follows: (note, the TAG is the Technical Advisory Group.)
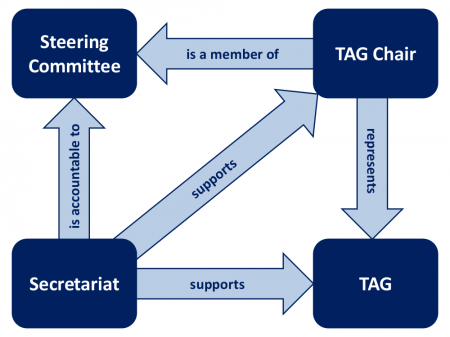
[Image taken from the IATI governance page, http://www.aidtransparency.net/governance]
To find out more about the Technical Advisory Group, you can follow what they’re talking about over on their discussion group.
OK, so the diagram might seem a little confusing, but it’s not strictly essential to understand it. There are, however, two quick things to mention before we look at data sources.
Firstly — that they (the groups above!) have developed a common, open standard for the publication of aid data, which is called the IATI Standard.
Why is this important?
Before the IATI standard came along, all of those organisations were producing (and collecting) data in various different ways, which made it impossible to compare them, or use them together. Now, the data is what we call ‘interoperable’, as it can be combined with other data sets, and used together to discover patterns, to see for example if lots of organisations are working on the same area, in the same region, or not.
The standard is regularly updated, and the latest update to version 2.01 was accepted formally by the Steering Committee in October 2014. If you’re interested in knowing more about the standard itself, go to the IATI Standard website, http://iatistandard.org/.
The version of the Standard doesn’t, or shouldn’t, affect too much how you use the data – but if you see various mentions of the IATI Standard popping up, this is what they are referring to.
More importantly though, they also manage the IATI Data Registry, which is where you can find links to all published IATI datasets. The datasets are usually hosted directly by the publishing organisation, but you can also find these links on other sites, which is what we’ll look at now:
Sources of IATI data
IATI Registry
| What is it? | The home of IATI data: the place to download IATI data in the datasets as they are provided by reporting organisations. |
| Who is it useful for? | People wanting to download data in the way that reporting organisations have structured it in xml, or csv, which you can open in a standard spreadsheet application. For example, if you are a publisher wanting to see how other organisations have published their data. |
| Give me an example of what I can get here… | A CSV or XML file of Asian Development Bank Activity in Bangladesh. |
| Bear in mind… | The data here is structured as provided by the reporting organisation – this means it might well be too “split up” for your needs, unless you’re focusing on how donor organisations are publishing their data. If you want to look at, for example, all activities by a certain donor in a certain country, the CSV Query Builder below is a better option for you. |
| Where can I go for further guidance? | Using IATI data |
Note: “publishing organisation” and “reporting organisation” are used somewhat interchangeably, to signify the organisation who is making the data available and publishing it to IATI. In both cases, it’s normally a donor organisation – ie. the organisation giving the money – or an ‘implementing organisation’ – ie. an organisation receiving the money from a donor and actually carrying out the project.
Quick users’ guide:
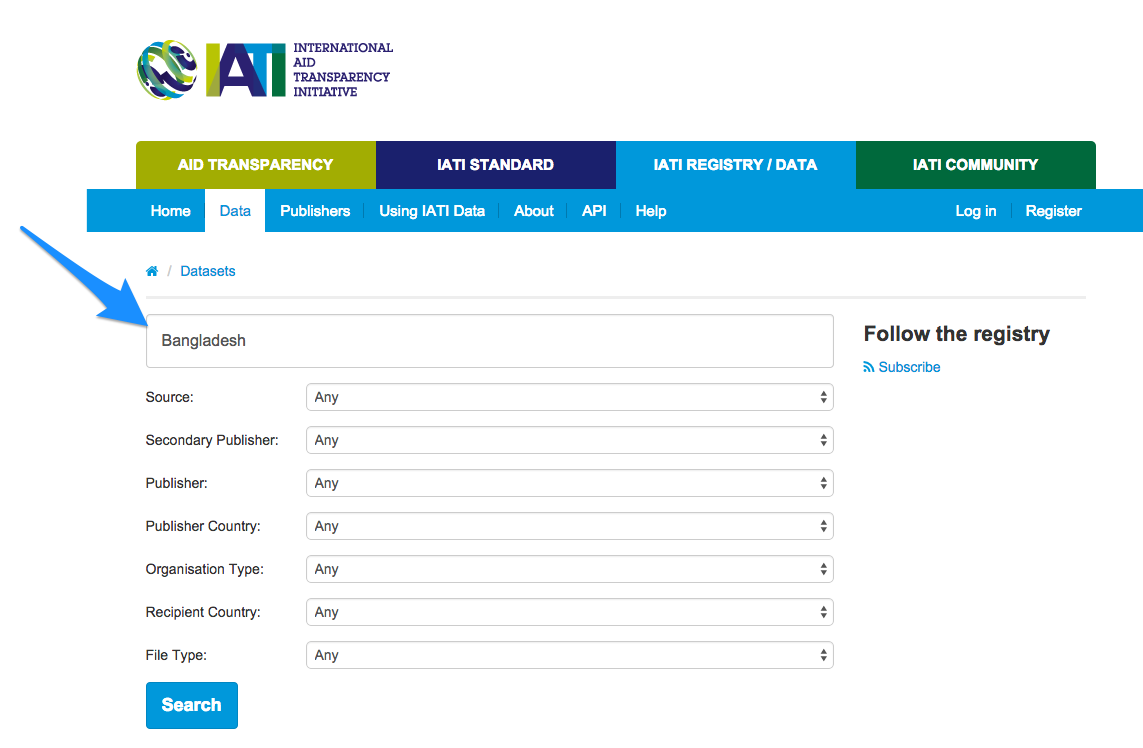
Go to http://iatiregistry.org/dataset – here you have two options for how to specify what you want.
You can either type keywords yourself, in the top box, for example here: Bangladesh, to see all files that mention ‘bangladesh’.
With this search, 28 datasets come up.
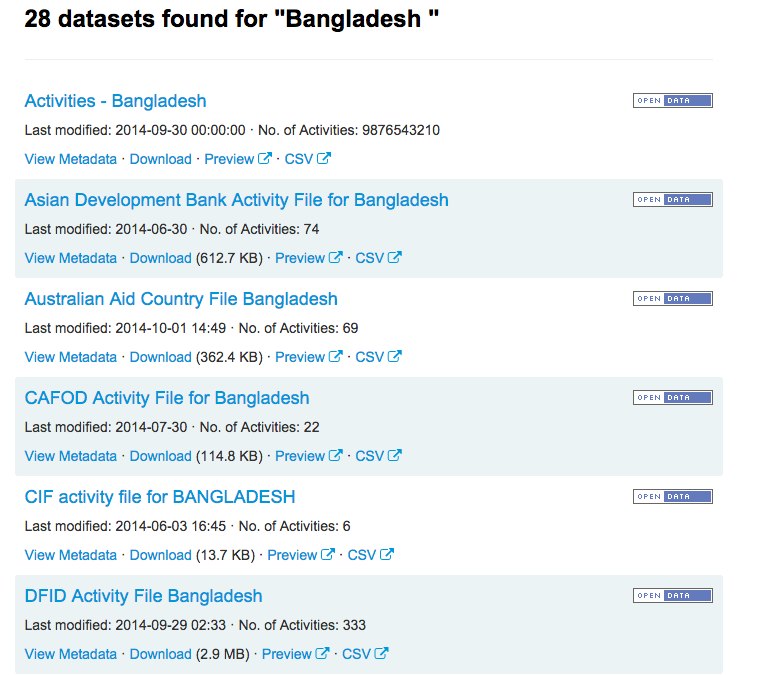
Under each file, you’ll see four options:
View Metadata: see data about the data – for example, the date it was published, the identifier of the publishing organisation, how many activities it includes, and the date range that these activities cover.
Download: clicking on this will give you the data in XML format, usually opening directly in your browser.
Preview: this uses a tool built by AidInfoLabs to allow you to ‘preview’ the data directly in your browser. It will bring up a screen that looks like this:
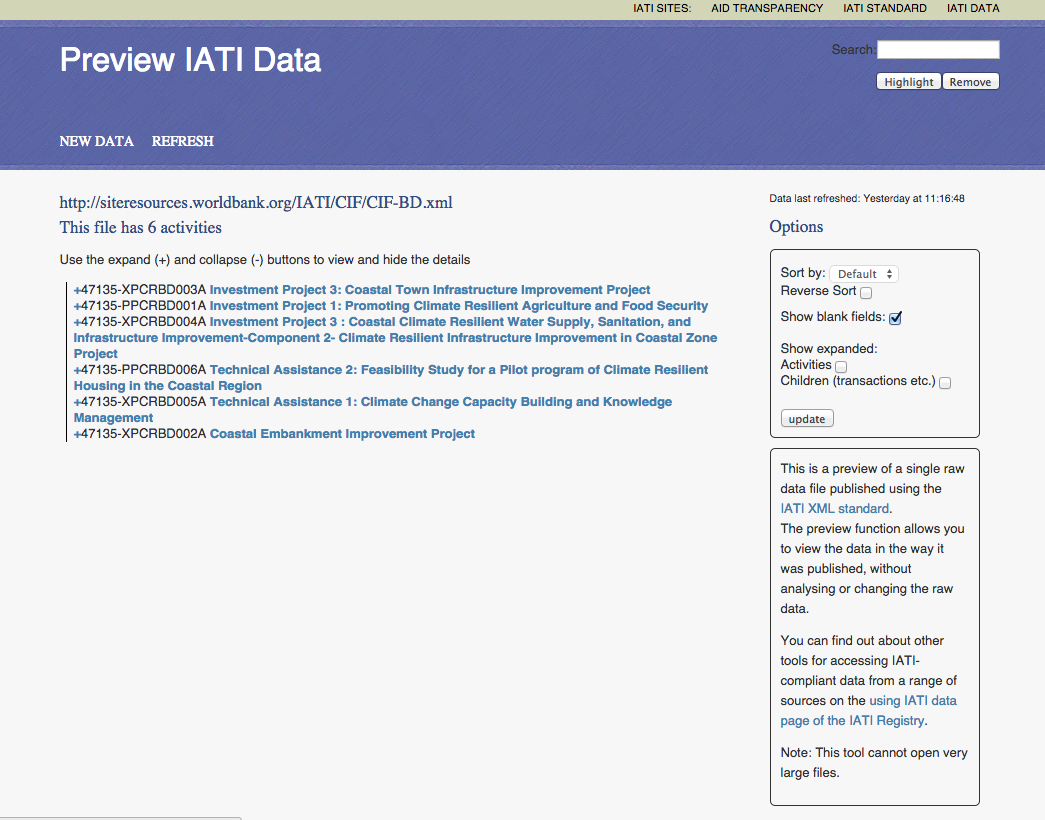
It can be a good idea to check on here before downloading big files to make sure they’re the ones with the information you need.
CSV: this will give you a download of the data in CSV format.
Another way of using this is through the drop down menus below; none of the fields are mandatory, and you don’t have to use them all, so just use the ones which are most relevant to what you’re looking for.
Remember though, the data here is structured and organised by how the publishing organisation has published it to IATI. Here’s a quick explanation of what the field names and options mean:
Source: who is publishing the data
Primary source: data which is published by the organisation which is carrying out the activities.
Secondary source: data published by a third party about the activities of another organisation.
Secondary publisher: specify which secondary source you’re interested in. You can ignore this field, unless you’re particularly interested in organisations publishing data about others’ activities.
Publisher: specify which publishing organisation you’re interested in (primary source). This is a long list to choose from!
Publisher Country: specify where the publishing organisation(s) should be based.
Organisation Type: specify what kind of organisation the publishing organisation should be. See ‘Jargon busting the Aid World’ for an explanation of the different types of organisations.
Recipient Country: specify in which country the activities should be taking place (ie. which country is ‘receiving’ the money, or the aid)
File type: this specifies whether you’re interested in finding out data about the organisation itself (Organisation) or about activities they have carried out (Activity). If you’re not sure, you can always leave it blank.
IATI Data Store CSV Query Builder (Alpha Version)
| What is it? | A “query builder” – a form where the user specifies what data is wanted from the IATI registry, presses “submit” and a CSV with the selections starts automatically downloading. Magic! |
| Who is it useful for? | People wanting to download custom CSV files of IATI data: you can get data per reporting organisation, by sector, by recipient country, all in CSV format. It might need cleaning afterwards, but it’s a good 1st step! |
| Give me an example of what I can get here… | All of the activities that take place in Bangladesh, that are published to IATI, by donor organisation, in a CSV. |
| Where can I go for further guidance? | User Guide |
Step by step walkthrough
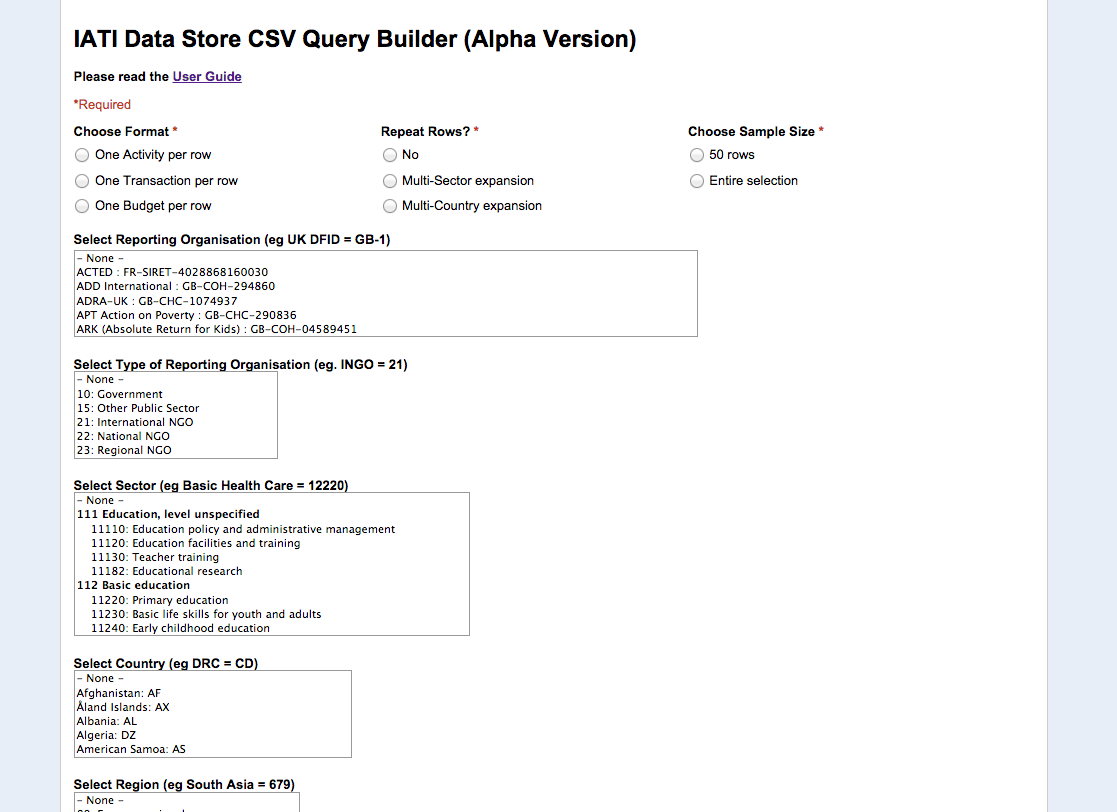
You should be met with something like the screen above when you click on the http://datastore.iatistandard.org/query/ .
The top three questions – Format, Repeat Rows, and Choose Sample Size are all mandatory.
Choose Format:
Here, you can choose the level of granularity you want in the CSV you will get. The easiest way to illustrate this is by looking at the data:
Let’s say we’re interested in what Action Aid UK is doing in Bangladesh.
If we select ‘One Activity per row’, ‘No” to repeating Rows and ‘50 rows’ sample size, then we would select ‘Action Aid UK’ in Reporting Organisation, and Bangladesh in the Country option. The screen would look something like this:

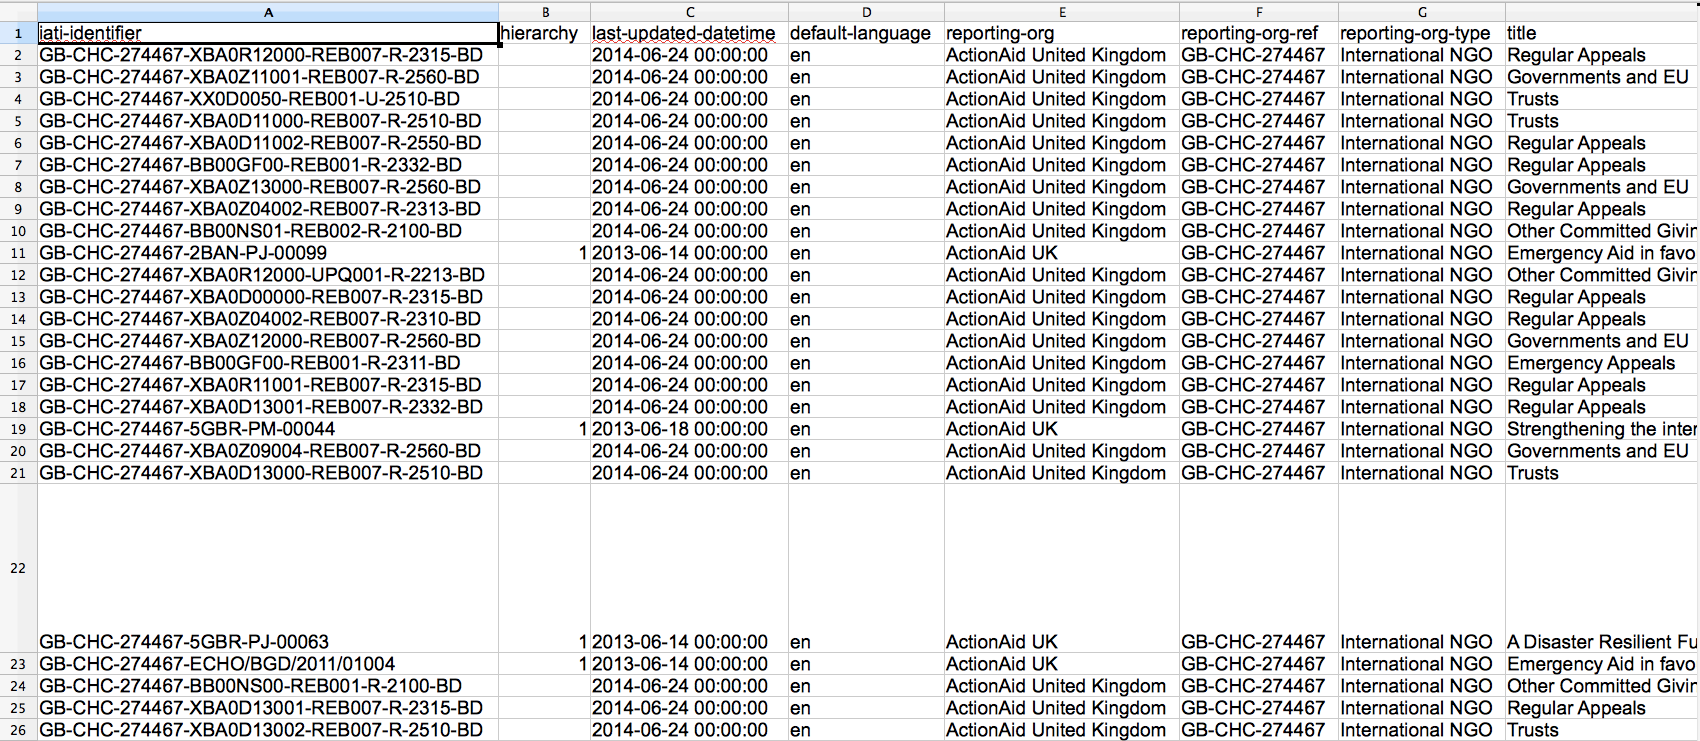
We’ll get a link to a dataset that looks like this:
You can also download this data directly from DataHub, here.
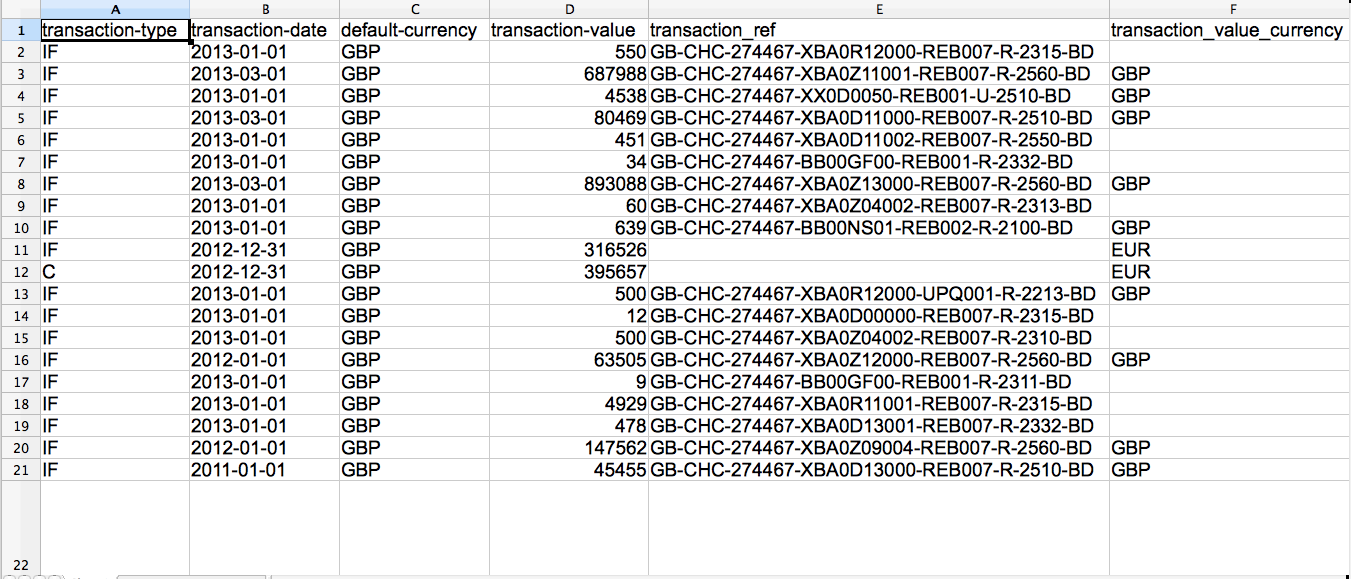
For comparison, now do the same (selecting ‘Action Aid UK’ and ‘Bangladesh’ as above) but instead of selecting One Activity per row,, choose One Transaction per row.
This looks something like:
(Download this data directly here)
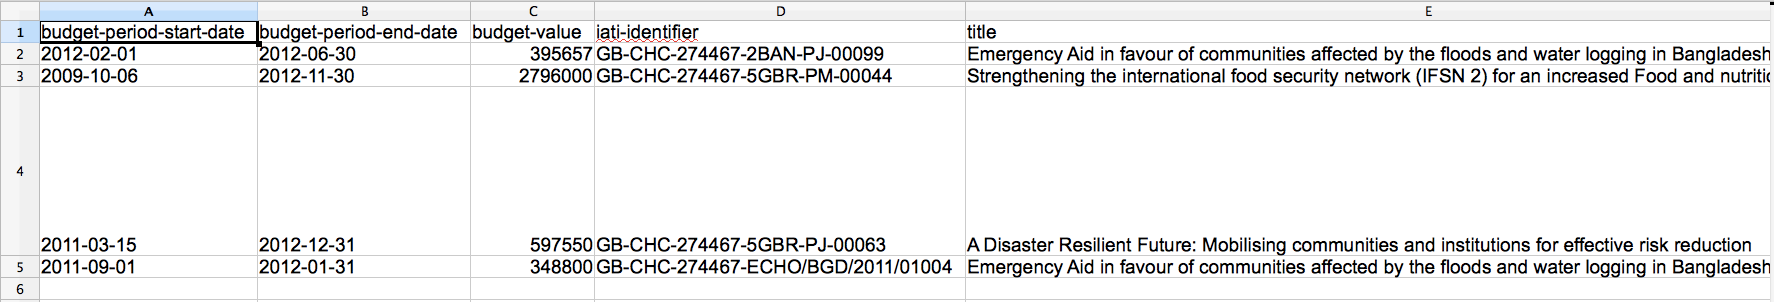
And one last time – compare it to the data you get when selecting One Budget per row, which will give you:
(Download this data directly here)
So maybe we can now see the differences already: essentially, One Activity per row is showing activities, or projects, carried out by the reporting organisation.
One Transaction per row is much more granular: it has information on every transaction, or transfer of money, between donor organisation to implementing organisation (in this case, Action Aid UK to Action Aid Bangladesh), and each transaction has an identifier, so it can, in theory, be tracked further.
One budget per row is higher level, and more aggregated: it shows from which date range the budget from the donor organisation is open, or running. It shows how much money is spent in total on certain projects or budgets.
With the Choose Country – this can be either the country in which the activities are taking place, or the country of the donor organisation.
As with the IATI Registry, described above, you can also choose which fields you select- only the top three are actually mandatory. In general, this is probably the best way to get data to then work with afterwards- though usually, it will require some cleaning first. (See module, Cleaning IATI data with OpenRefine.)
Have a play!
IATI API
| What is it? | An [API (application programming interface)](https://schoolofdata.org/handbook/recipes/intro-to-apis/) for IATI data: ie. a way for applications to communicate with one another. |
| Who is it useful for? | Developers building applications with IATI data, people wanting IATI data in XML, CSV, or JSON. |
| Give me an example of what I can get here… | An XML of all DFID activities in the Democratic Republic of Congo. |
| Bear in mind… | If you’ve not used APIs before directly, then there are other places (ie. the CSV query builder) through which you can get files of the data you’re looking for, in an easier way. |
| Where can I go for further guidance? | It’s well documented on the page above, http://datastore.iatistandard.org/docs/api/ |
Sources of data about IATI data
ie. metadata about what is in the registry – how many datasets, how often certain publishers are publishing their data
IATI Registry API
| What is it? | An API on meta data (ie. data about the data) for IATI data, which returns the data in JSON format. |
| Who is it useful for? | People wanting to build applications about what data is going into the IATI Registry, and where it is from. |
| Give me an example of what I can get here… | Data about DFID’s publishing activities – how often they publish, how much they have published, etc. |
| Where can I go for further guidance? | The IATI Technical Advisory Group discussion list |
IATI Dashboard
| What is it? | It provides statistics, charts and metrics on data accessed via the IATI Registry, generated nightly from the IATI data on the registry. Essentially, metadata on IATI data (data about the data). |
| Who is it useful for? | People wanting to track IATI data – see who is publishing and how much, rather than diving directly into the data itself. Or, for publishers themselves to see the state of data; it can also be a useful tool to point to when talking to publishers about their IATI data. |
| Give me an example of what I can get here… | An overview of how many activities are published to IATI in total, updated daily. |
| Bear in mind… | |
| Where can I go for further guidance? | The IATI Dashboard README and the IATI Dashboard FAQs |
IATI Updates
| What is it? | A site which makes it really easy for you to see how often different organisations are publishing to IATI, and what they have most recently published. |
| Who is it useful for? | People who might be specifically interested in a certain organisation: unlike on the Dashboard, you can search and select by organisation, to see what their average activities are, and via the [Revisions](http://tracker.publishwhatyoufund.org/iatiupdates/revision/) option, see what exactly they have recently published. |
| Give me an example of what I can get here… | A list of the most recent files (=’packages’) that the African Development Bank published to IATI. |
| Where can I go for further guidance? | It’s pretty self-explanatory, so no particular guidance documents here. If you have any particular problems, it’s probably easiest to open an issue on the Github repository |