Module Objectives:
- Understand why IATI data might need ‘cleaning’
-
Learn familiarity with the data cleaning tool Open Refine
-
Work with IATI data (downloaded as CSV from the IATI registry)
Prerequisites/before you get started:
-
Basic understanding of spreadsheets
-
Basic understanding of what IATI data shows
-
Understanding of what a CSV is
Table of Contents:
-
Getting IATI data in CSV format
-
Creating a project in Open Refine
-
Sorting and facetting
-
Different kinds of facets
-
Cleaning multiple entries in single cells
Introduction
Why might data need “cleaning” anyway? We say the data needs cleaning when it has inconsistencies that make it difficult to work with; although it might already be in a spreadsheet, there are lots of ways that it could actually be “dirty” data.
For example, when dates are written in different formats in the same spreadsheet: 21st October, or 21/10/13, or Oct. 21. Or, when names are spelt slightly differently, but actually mean the same thing. All of these things (whether by human error, or machine) – make it very hard to analyse the data. As lots of IATI data has been processed by hand, little inconsistencies are common within the files you find in the IATI registry, and before you can properly work with it, it needs to be cleaned.
So, here is an introduction to a powerful data cleaning tool, which is free to download.
What you’ll need:
- Refine – Download it from http://openrefine.org. If you’re downloading it using a Mac, there might be a bug, telling you:
“Google Refine” is damaged and can’t be opened. You should move it to the Trash.”
To get around this problem, follow these instructions:
- Open System Preferences
-
Open Security & Privacy
-
Go to the General Tab
-
Change the “Allow applications downloaded from:” setting to “Anywhere”
(This appears to be a security issue with Mountain Lion, but the above steps provide a workaround until it is fixed by Google.)
Step 1: get the data
We’re going to be working with data in csv format, downloaded from the IATI Registry. Go to the Registry and click on Search the Registry.
There are lots of ways to find what you need within the Registry – easiest though, is simply by searching. Let’s say we want to look at projects taking place in Bangladesh – so, type in ‘Bangladesh’ to the search bar.
You’ll get 28 datasets found for “bangladesh”.
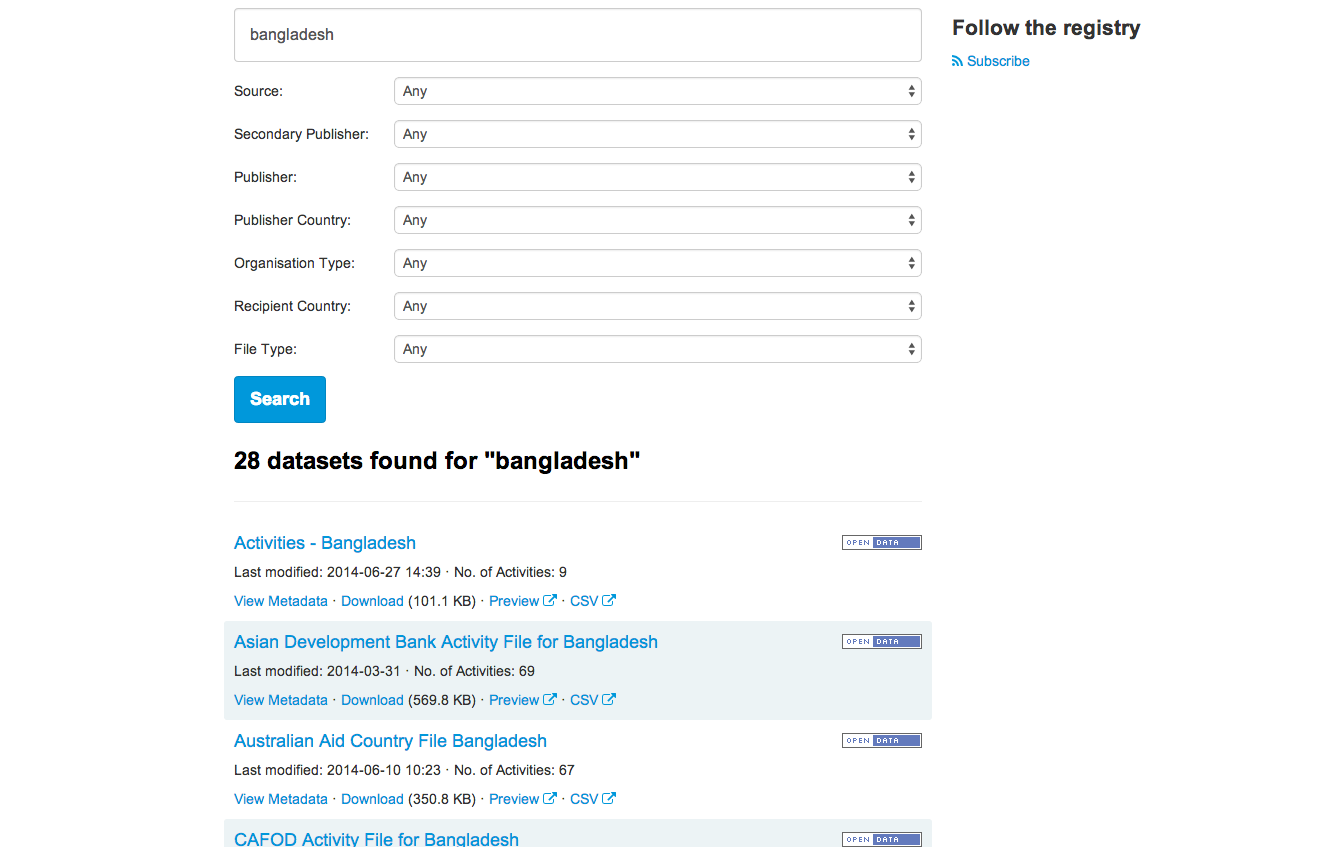
Let’s take a look at what the Asian Development Bank is doing in Bangladesh – the second entry in the list.
We want to work with the data in CSV, so click straight on to the CSV button underneath the entry for the Asian Development Bank.
You’ll come to the CSV Conversion tool then, where you’ll see the URL for the raw data, from the Asian Development Bank site itself, and three options:
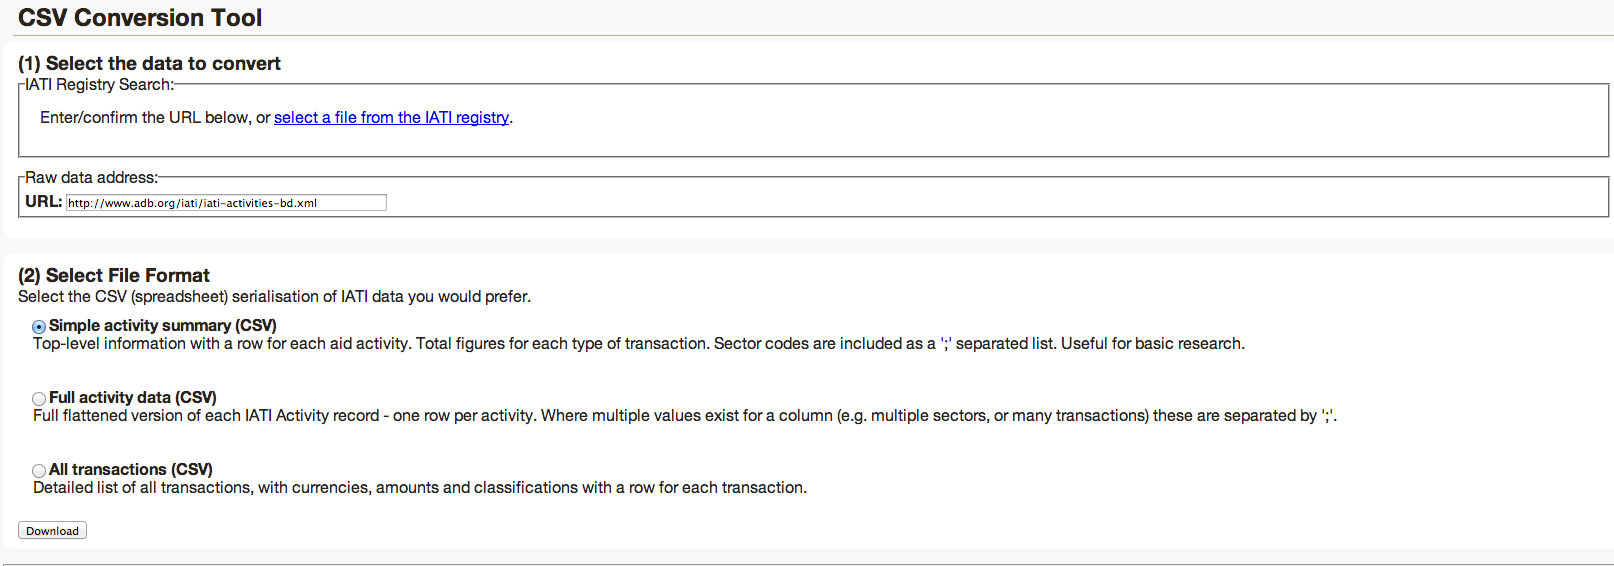
In this example, we’re going to use the data from the Simple activity summary, which has aggregated figures rather than a row per transaction, and allows you to see ‘implementing organisation’, contact details of the relevant organisation and contact person in Bangladesh, and other interesting information.
Select ‘Simple activity summary (CSV) and click ‘Download’.
You’ll come to this page, and your data should start to be automatically downloaded.
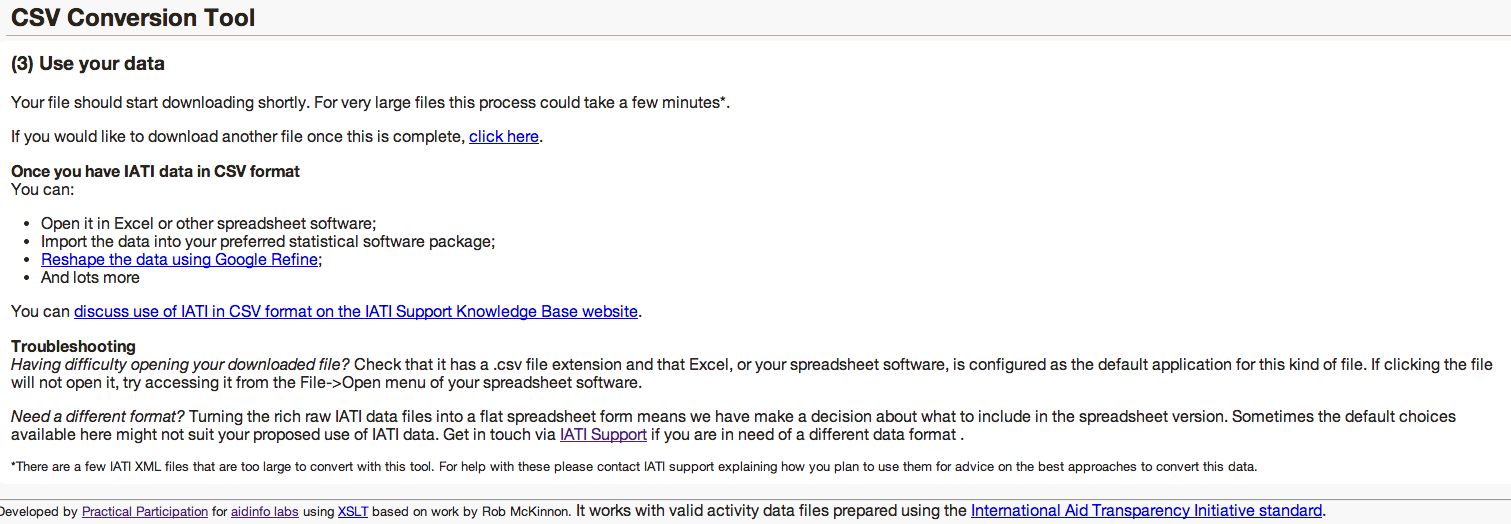
Now, we need to open this data in Open Refine.
Step 2: Creating a new Project
Open Refine (previously Google Refine) is a data cleaning software that uses your web browser as an interface. This means it will look like it runs on the internet but all your data remains on your machine and you do not need an internet connection to work with it.
The main aim of Refine is to help you exploring and cleaning your data before you use it further. It is built for large datasets – so, as long as your spreadsheets can hold the information, Refine can too.
To work with your data in Refine you need to start a new project:
- Start Refine – this will open a browser window pointing to http://127.0.0.1:3333 – if this doesn’t happen open the link with your browser directly
-
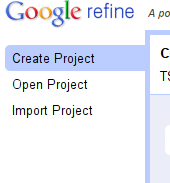
Create a new project: On the left tab select the “Create Project” tab:
- Click on “Choose Files” to choose the downloaded file of Asian Development Bank activities in Bangladesh, and click on “next” – you can also use the URL to the CSV directly if your data is hosted on the web.
-
You will get a preview on how Refine will interpret your data -as we have selected a well formatted CSV, this should be pretty automatic, and the ‘Columns separated by comma (CSV) option should be selected at the bottom of the page.
-
Review the preview carefully to make sure the data looks right. Double check character encoding, to see if there are any funny characters that show up.
-
You may want to turn off “guess data types”, particularly if you have data that contains leading zeros in numbers or identifiers which are significant.
-
Name your project in the box on the top right side and click on “Create Project”
![]()
- The project will open in the ‘project view’; this is the basic interface you are going to work with. By default refine shows only 10 rows of data, but you can change this on the bar above the data rows. Also, you can use the navigation on the right to see the next or previous rows.
You now have successfully created your first refine project! Remember: although it runs in a web-browser, the Refine server is still on your machine – all the data is there.
Step 3: Sorting and Faceting
Now that we have created our project, let’s go and explore the data and the Refine interface a little. Using Refine might be intimidating at first, since it seems so different from spreadsheets, but once you get used to it you will notice how easily you can do things with it.
One of the commonly used functions in spreadsheets is sorting and filtering data – to figure out minima, maxima or things about certain categories. Refine can do the same thing.
One of the first things to notice when looking at the data, is that the first two entries under the column ‘aid_project_title’ appear to be the same text, but are written one in uppercase, one in lowercase, and with a spelling omission, too. Remember what we said earlier about messy data? This is a prime example.
To see if there are any others errors like this, let’s use the ‘facet’ function.
Click on the little arrow next to the column title, and then select Facet → Text Facet.
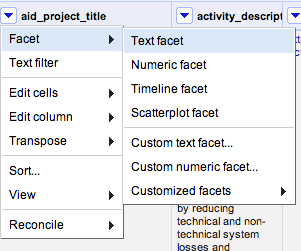
What does ‘Facet’ actually mean? Essentially, filtering. Faceting in Refine is really powerful – you can do a lot to your data using facets.
Here, we’re going to clean up the columns a little. Clicking Text Facet will open a facet in the left sidebar. You can see that there are 62 choices given – are any of them doubled up, like in the first two rows?
Scroll through and see.
The ‘Gas Transmission’ project that we noticed at the top is here, and we can see that there are just two projects with this title; however, they are considered as separate projects due to the spelling mistake + difference in caps used).
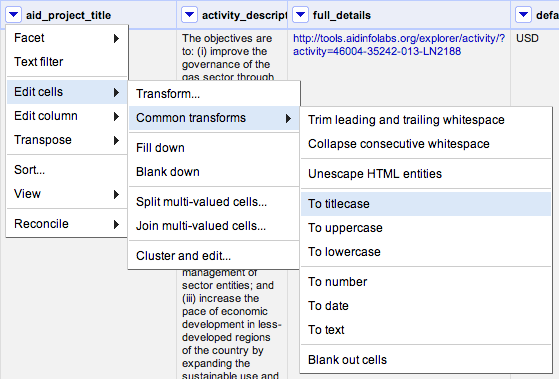
We can get rid of the block capital letters quite easily, by clicking on the triangle at the top of the aid_project_title column and selecting Edit cells → Common transforms → To titlecase.
Then, we use the ‘Cluster’ feature to automatically find projects that have the same name. To activate clustering, click on the ‘Cluster’ button in the facet.
You will end up in the clustering menu – there, click on the drop down menu next to Method, and select ‘nearest neighbour’.
Then, you should see two entries come up: the Gas Transmission project we first noticed, and another one with an 0 instead of an O in the word ‘transport’.
If you click on one of the options, that text will appear in the corresponding New Cell Value window. It will also tick the ‘merge’ box. When you click the Merge button, the lines that are ticked will be rewritten with the appropriate New Cell Value.
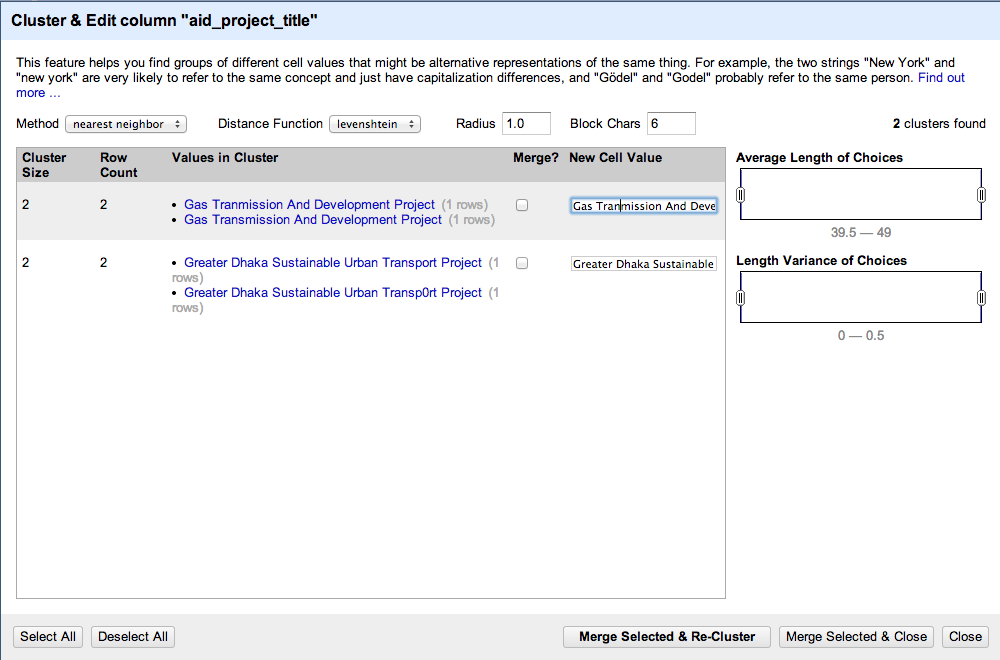
Make sure the ‘New Cell Value’ is written out correctly, and then click ‘Merge Selected & Re-Cluster’. No others come up, so you can close the window. It is often worth trying one or two different measures (Distance Functions) when trying to cluster partially matching strings, as each measure works slightly differently.
What does ‘Distance Function’ mean? The different distance measures take different times to run and use different rules to try to work out what is the same as what. In levenshtein, the distance is the number of single character “edits” that map one string to another. If you try the ppm rather than levenshtein distance measure you get different results.
In the key collision method, there are a couple of interesting techniques that try to find strings that “sound alike” (metaphone3 and cologne phonetic). These are quite quick and dirty methods, but they can work well
Exercise 1:
You can check to see if there are similar problems in any of the other columns, too – for example, if you set a Text Facet up for the column ‘sectors’ you’ll see that there are two similarly named sectors:
Transport And Ict, and Transport and ICT.
Click ‘Cluster’ and see if you can merge them!
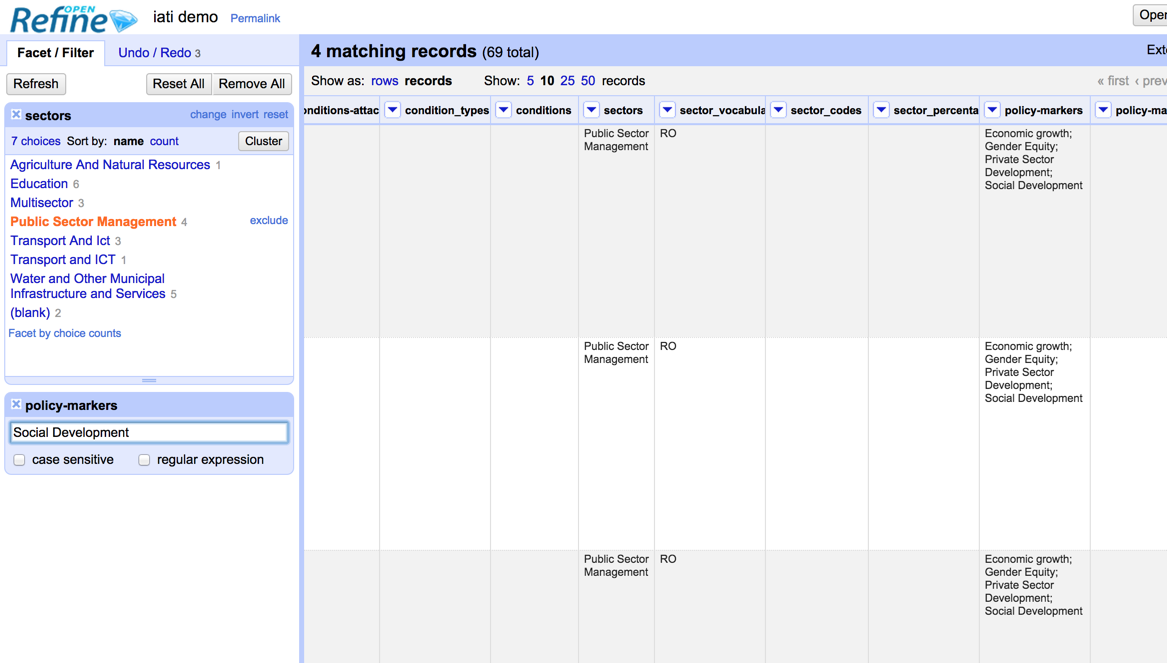
Exercise 2:
Narrowing down your search: try to find all projects in Public Sector Management that have a Social Development policy marker. (tip: try using a facet on one column, and a filter on another)
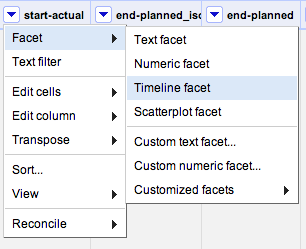
Different kinds of facets
As you saw when you created the Text facet just now, there are other kinds of facets – let’s create a Timeline one, to make it easy to see when projects started (and stopped.)
Go to the column start_actual; in this column, can see the dates that projects started. Create a Timeline facet, by clicking on Facet → Timeline facet.
Hmm – it doesn’t seem to work- this is what we see, and it appears to be blank! Why?
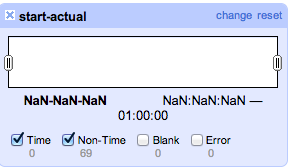
The dates given in the start_actual column don’t seem to be recognised as dates (or ‘Time’) so they’re not coming up in the Timeline facet.
Luckily, if the date is in the format specified in the IATI standard this is easy to change: just ‘transform’ all of the entries into that cell into ‘dates’, by clicking Edit cells → Common transforms → To date
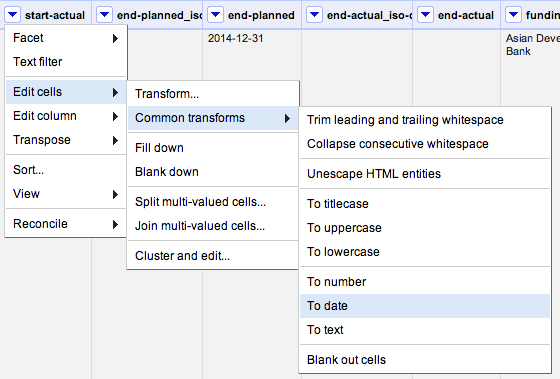
You can go ahead and do this transform on all of the columns that you can see which have dates in – start-planned, and end-planned too.
Once you have, you’ll be able to apply a Timeline Facet which allows us to see when projects were started.
Cleaning multiple entries in one cell
You may notice that in some of the columns, there are multiple entries:
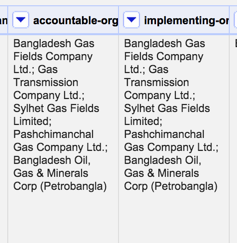
If we wanted to list just the rows that involved Sylhet Gas Fields Limited we could select the Text filter option, enter the company name, and just see the corresponding rows.
However, we might also want to reshape the data so that we have one line for each accountable-org or implementing-org. We can achieve this in OpenRefine in two steps. The first step involves generating a new row for each entry in a particular column. From the Edit Cells menu option select *Split multi-valued cells… * and then enter the character that is used to separate the different items within the cell – in this case, a semi-colon (;) character.
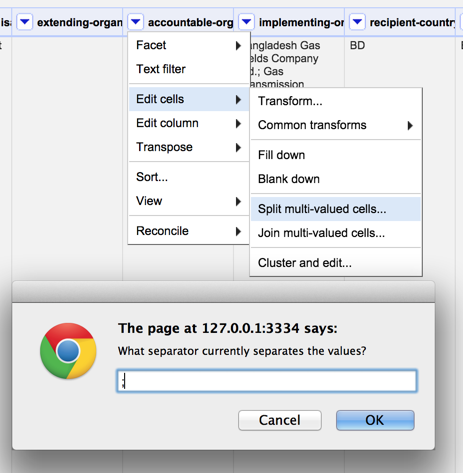
For each item in the cell, a new row is created and the distinct values filled in within the original column – that is, the column whose cell values we split.
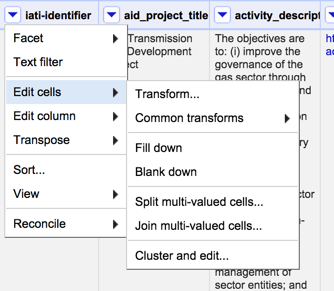
If you inspect the other columns, you will notice that all the cells in the newly created rows are blank.
To fill in the blanks, we need a second step – for each column, select Edit cells then Fill down. This works down each row in the dataset, looking for empty cells and filling them with whatever value appears in the cell next filled cell above.
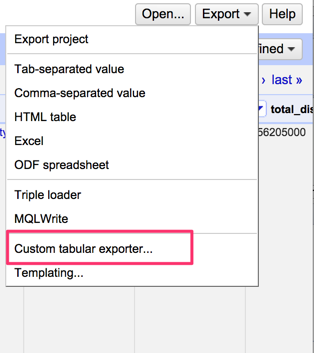
For a dataset such as this one, there are obviously of a lot of columns that need filling in – which could take some time. But do you really want data from every column? Perhaps all you really wanted was a list of accountable organisation aims and the IATI project identifier – in which case you’d only have to fill down on that column.
You could then export just these two columns of data using the Custom tabular exporter from the project Export menu; this would give you a more specific selection of the entire data set to work with.
Congratulations! You’ve cleaned up a dataset using Open Refine.
Further resources:
-
Tony Hirst’s various blog posts on Open Refine
-
David Huynh’s Google Refine tutorial, from NICAR 2011
-
Using Google Refine to clean messy data – from the ProPublica Nerd blog, by Dan Nguyen
-
Google Refine screencasts (3 videos in total)