Introduction

Image source (with adaptations). Public Domain licensed.
Three is not a number. Nor is a million. At least not when they are typed in as text in a cell in a spreadsheet. Your spreadsheet is your awkward and pedantic friend that needs everything to be precise, defined and consistent. If you don’t do this, your spreadsheet will become confused and start making an evil witch’s brew, as depicted above. Here’s how you and your spreadsheet might see things differently:
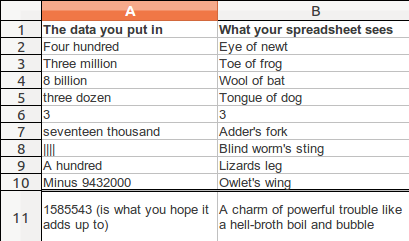
(If the witches in Shakespeare’s Macbeth (see IV, i, 14-15) had a spreadsheet it would look like the above).
With spreadsheets, there are three basic data formats. Or in other words, three ways you can enter data into a spreadsheet cell:
- as a number, like 100.
- as text, like one hundred.
- as a formula, like =SUM(99+1), which creates a “calculated value”.
To avoid creating a witch’s brew in your spreadsheet, follow two basic rules of thumb:
- Be consistent and don’t mix them up in a column of data.
- Let the spreadsheet know what type of data is in each column.
If you ignore these rules, your spreadsheet will have difficulty doing all the useful things for which we entered the data in the first place, like adding, subtracting, counting, sorting, filtering and so on. After completing the tasks in this section you’ll have gained:
- understanding of different data types that can be used in spreadsheets
- sorting data to find errors in data type
- standardising data entry and using formulas to detect errors
Some Work
To do both the quick and longer tasks below you’ll need:
- a spreadsheet tool, such as Excel or Libre Office.
- a copy of the course dataset, which is GRAIN’s data on “land grabbing”.
A quick task (15 minutes)
Download a copy of the GRAIN database of land grabs onto your computer. Load the spreadsheet and consider the following:
- What sort of data type do you think the data in each column should be? Find out what type of data the spreadsheet thinks it is by right clicking on the column heading, selecting Format Cells and looking at the “Numbers tab”. What do you see? Try choosing different options from the Category and Format lists and see what happens to the data.
- Where there are some numbers in a column, can you add them up and see what happens? Use your common sense: does the sum look too big or too small? Does it produce an error? This may tell you there’s something wrong with the data.
- Where there is text or numbers, try sorting in ascending order, and see what happens. Does it behave as you would expect?
- Use Auto-Filter to display the distinct values in a column so you can see what sort of data is in the column. Does anything stand out to you as strange, or inconsistent? Can you see mixes of different data types?
After probing the data in these four different ways, what is your impression about how easy the data is to analyse using the spreadsheet? How could you improve the data?
Use the discussion area to let us know what you think.
A longer task (an hour)
From the Data Wrangling Handbook Recipe on Data Cleaning, run through “Problem 4: Fixing Numbers that aren’t numbers” using the GRAIN dataset. This step-by-step exercise explores the specific problem of how data on the size of investments in different land deals has been recorded in the dataset. It explains how you can detect and solve the problem using formulas, and use features like Pivot Tables to check your solutions are working. It will give you a strong idea of how to combine different spreadsheet functions and features.
Reading list
- Here’s a detailed run through of the different basic number formats that are available in Excel.
- These basic practical spreadsheet skills are useful in exploring and testing out the data:
- Adding up a column of numbers, using Google Spreadsheet as an example
- Sorting data, using Google Spreadsheet as an example
- Here’s how to apply auto-filter in Excel.
- The sort and filter course in data fundamentals.
- Many people find problems with data types when they start using forms of numbers that are very particular, such as organisational reference numbers, like social security or national identity numbers, telephone numbers, locational information like latitude and longitude. Spreadsheets can build “Custom number formats”. Here’s some reading about them.
- A simple example from TechRepublic of how custom number formats solve annoying problems in spreadsheets.
- A detailed note about how custom number formats work, by Ozgrid.
- A nicely put together reference for common custom number formats in Excel, by Simon Page.
Rest and reflect
This has been a tricky exercise. How was it for you? Is it easy to make the spreadsheet help you find and correct existing errors?
The long task was pretty difficult too. Did you get through it?
Use the discussion area to share your thoughts on this section.
If you’re keen for more, then head over to the fourth section of this course, called “Did you bring the wrong suitcase (again)?”
This course was created for the School of Data by Tactical Technology Collective. Tactical Tech is an international NGO working at the point where rights advocacy meets information and technology.
Last updated on Sep 02, 2013.