What you’ll need:
- Refine – Download it from openrefine.org
- The sample Dataset – Download it from Africa Open Data
Step 1: Creating a new Project
Open Refine (previously Google Refine) is a data cleaning software that uses your web browser as an interface. This means it will look like it runs on the internet but all your data remains on your machine and you do not need internet connection to work with it.
The main aim of Refine is to help you exploring and cleaning your data before you use it further. It is built for large datasets – so don’t worry as long as your spreadsheets can keep the information: Refine can as well.
To work with your data in Refine you need to start a new project:
Walkthrough: Creating a Refine project
-
Start Refine – this will open a browser window pointing to http://127.0.0.1:3333 if this doesn’t happen open the link with your browser directly
-
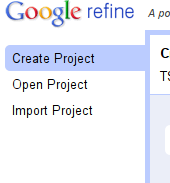
Create a new project: On the left tab select the “Create Project” tab:
-
Click on “Choose Files” to choose your downloaded file and click on “next” – you can also use the URL to the CSV directly if your data is hosted on the web.
-
You will get a preview on how refine will interpret your data – if you have selected a well formatted CSV or other file: this should be pretty automatic.
-
Review the preview carefully to make sure the data looks right. Double check character encoding. Much, but not all data uses UTF-8 these days, but make sure you don’t see any funny characters in preview.
-
You may want to turn of “guess data types”, particularly if you have data that contains leading zeros in numbers or identifiers which are significant.
-
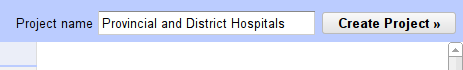
Name your project in the box on the top right side and click on “Create Project”
-
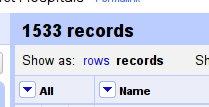
The project will open in the project view, this is the basic interface you are going to work with: by default refine shows only 10 rows of data, you can change this on the bar above the data rows. Also you can use the navigation on the right to see the next or previous rows.
You now have successfully created your first Refine project. Remember: although it runs in a web-browser, the Refine server is still on your machine – all the data is there (so no worries if you handle sensitive information)
Step 2: Sorting and Facetting
Once we created our project, let’s go and explore the data and the Refine interface a bit. Using Refine might be intimidating at first, since it seems so different from spreadsheets, once you get used to it you will notice how easily you can do things with it.
One of the commonly used functions in spreadsheets is sorting and filtering data – to figure out minima, maxima or things about certain categories. Refine can do the same thing.
Walkthrough: Sorting rows
-
Refines handles data similar to a spreadsheet: you have rows, columns and cells – a cell is a field defined by a row and a column.
-
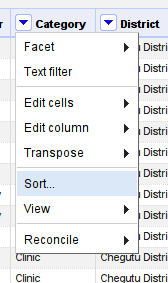
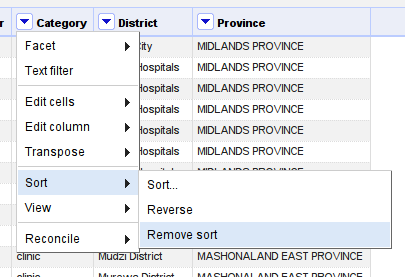
To sort your rows based on a specific column click on the small downward triangle next to the column
-
Select “Sort…” to open the sorting dialog
-
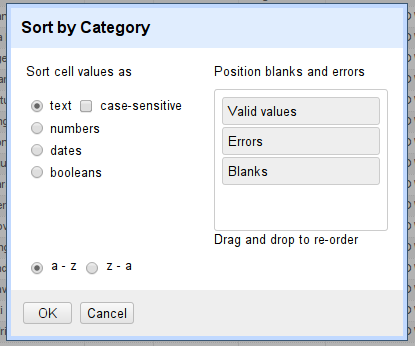
You can select what to sort the values as and then what order to sort in. (We’ll sort in text, since for now we only have text columns)
-
Click “OK” and your rows will be sorted based on the column
-
To undo the sort, click on the column options again, select “sort” then “remove sort”
The other frequently used function in Spreadsheets is filtering – in Refine this is called facetting. Facetting in Refine is really powerful – you will see in most of the rest of the Recipe we’ll use facets.
Walkthrough: Facetting rows based on a column
-
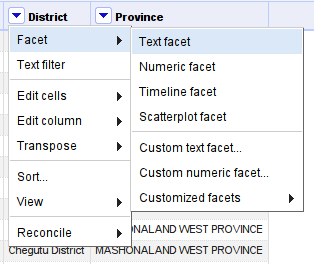
Select the column options for the column you want to facet with
-
Select “Facet”
-
You can facet differently for text, numbers or dates – let’s facet as text – click on “Text facet”
-
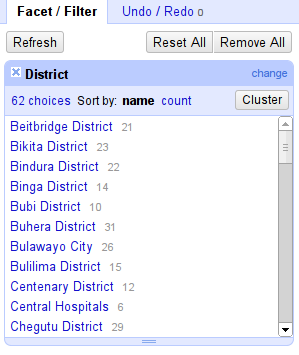
This will open a facet in the left bar
-
Now select one or more of the choices and you’ll see how your data rows are limited to just those selected.
-
Of course you can add more than one facet and thus filter more than once.
Step 3 Dealing with Blank Cells
If you look closely at your facets, you’ll notice that on the bottom you have a selector saying “(blank)” for this – we’ll need to deal with it.
Walkthrough: Filling in the (blank)s
-
Choose the “(blank)” facet in your “Owner” column
-
If you look at some of the rows, you’ll see that there was a mis-split of the columns and the owner actually ended up in the “Category” Column
-
To fill this into the “Owner” Field hover over the cell you want to fill in and click the “edit” button.

-
If you click the “Edit” button you can add the Owner there – don’t forget to also correct the “Category” cell.
-
You’ll notice some rows seem to be erratic – they don’t have a name that makes sense and no further information – you can flag these for deletion by clicking on the little flag.
-
Do the same with the “Category” Column – the Category is sometimes joined with the “Name” column
-
Now let’s delete the flagged rows – make sure you are in row mode for this: for this click on “row” in the top left corner above the data.
-
Open the column options for “All” and select “Facet” – “Facet by Flag”
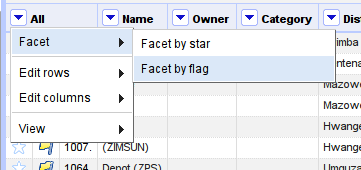
-
Now you can select “true” in your flag facet on the left.
-
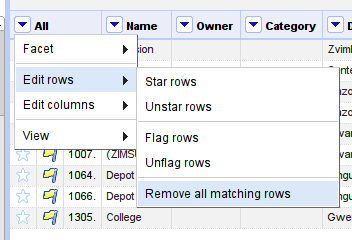
Now let’s delete the flagged rows: in the Column options for “All” select “Edit rows” – “Remove all matching rows”
Step 4: Fighting the Invisible Man
As illustrated in The Invisible Man is in your Spreadsheets having spaces or newlines in your datafields is a problem. Since this is a very common problem, Refine has specific functions to remove whitespaces that shouldn’t be there.
Walkthrough: Removing hidden whitespaces
-
Let’s start cleaning our Dataset with the Owner Column
-
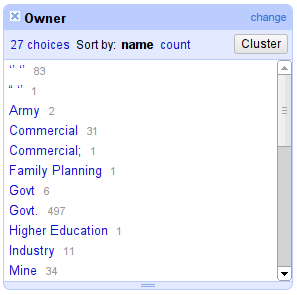
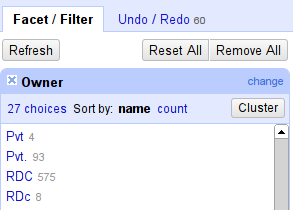
Create a Text Facet for the Owner Column as described above
-
You will notice that there are several things odd in the column: It starts with a long list of similar looking entries – we’ll deal with it later.
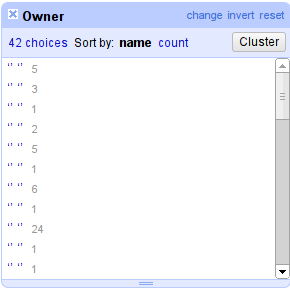
Although they look similar to you, they are different for the computer – there is a different number of spaces between the quotes.
-
Scroll down and you’ll notice that some entries will be there twice – although they look similar. There are two entries for Municipality that look exactly the same. This is because they have whitespaces at the end.
-
Refine can help you clean this up in an instant – open the column options for the “Owner” column
-
Select “Edit Cells” – “Common Transforms” – “Trim leading and trailing whitespaces”
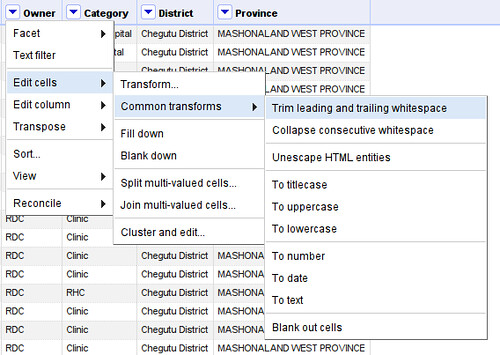
-
This will remove whitespaces in the beginning and at the end of your column
-
Check Municipality and you’ll note that there’s only one choice now – perfect. Now let’s deal with the list at the beginning.
-
Select “Edit Cells” – “Common Transforms” – “Collapse consecutive Whitespaces”
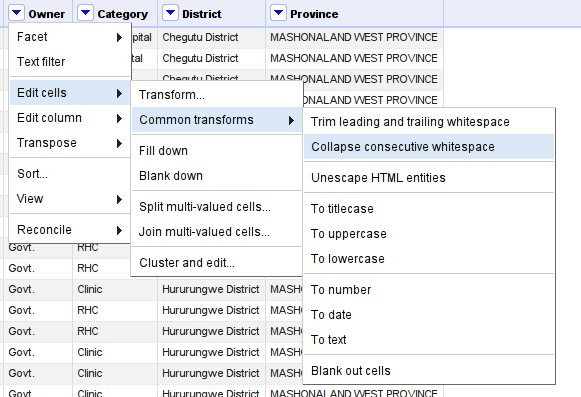
-
You’ll see the multiple choices have been reduced to two choices in an instant
-
Now our list already looks a lot cleaner!
-
Go ahead and apply the two transforms to all your columns.
Once you made your transforms you might wonder: What if I made a mistake? Also if you work with data you generally want to keep track of what you did to the data. Since Refine was build with data processing in mind it keeps track of what you’re doing with your data and allows you to go back and forth in time. To see your history of changes click on the “Undo/Redo” tab on the left.
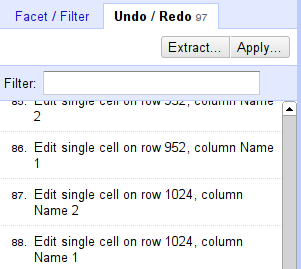
You see all the changes you made – by simply clicking on one of the steps you’ll be undoing all the changes after the step (don’t worry you can redo pretty much the same way). Play with this system until you are comfortable.
Step 5. Reconciling categories
A quick look at our categories and you’ll notice that not everything is well in Owner land – still some categories that should be the same are not. The same for the “Category” column – let’s reconcile them.
Walkthrough: Reconciling Categories
-
Create a Facet for the column you want to reconcile (in our case this is “Owner”)
-
The first step is to bring the categories to the same case – see for example “Town Council” and “Town council” – the difference is just one letter.

-
Refine can help you to automatically find the categories that belong together – a feature it calls “Clustering”. To activate clustering click on the “Cluster” button in your facet.
-
You will end up in the clustering menu – as you can see Refine is pretty smart about which things should belong together
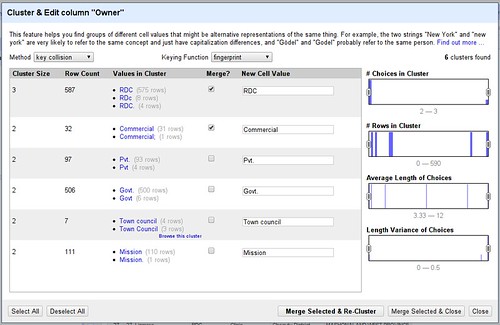
-
Check the “merge” checkbox if you want the two categories to be the same. Once you marked all the categories you want to merge click on “Merge selected & Re-Cluster”
-
If Refine doesn’t find more values to be similar change the “Keying Function” and see whether you can find more similar categories – if not: simply click close to continue.
-
This reconciled some of your values – let’s go on.
-
Look at “Mission” for example we have three different categories for what should be one – Refine did not automatically find them.
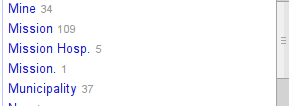
-
Let’s change them all to mission
-
Hover over “Mission Hosp.” notice the “edit” button at the end?
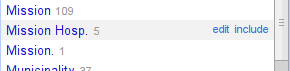
-
Click on Edit – this will open the field for editing. Change the name to “Mission” – this will change “Mission Hosp.” to “Mission” in all cells where it appears – continue on to change all the fields you can find.
-
Repeat reconciling for “Category”
Step 6: Splitting Columns
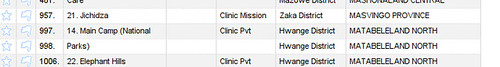
If you look at the “Name” column in our dataset you’ll notice that the names commonly start with a number (this is an enumeration of hospitals in a district – and is an artifact from extracting the data). Let’s clean this up and split the number and the name.
Walkthrough: Splitting Columns
-
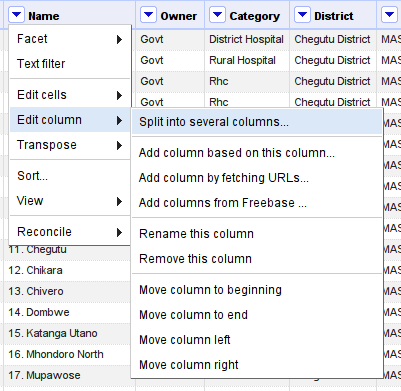
To Split a column select “Edit Column” “Split into several columns”
-
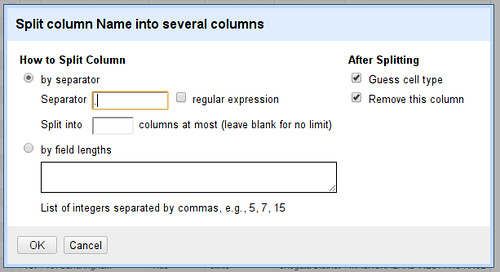
We want to split at a “.” since the number generally ends with a “.”
-
Enter “.” into the Seperator for in the split menu – since we only want to have two new columns enter 2 into the field below so the sentence reads “Split into 2 columns at most”
-
Click on “OK” and you’ll end up with two columns.
-
On some of the rows the split will fail – to fix those, create a facet on the second column and select “(blank)”
-
You can now manually fix the cells.
Congratulations – You successfully cleaned up a dataset using Refine!
However there is even more you can do with Refine: For example did you notice how there is always a number next to the categories in the facet – telling you how many rows are in that category? By combining two facets, can you find out how many clinics the government owns? And who owns the Provincial Hospitals?
Last updated on Sep 02, 2013.