The Data Pipeline
The Data Pipeline is School of Data’s approach to working with data from beginning to end. Once you understand your action cycle and the stakeholders, it will be time to work with the data and we have broken down this process in steps. The Data Pipeline is a work in progress, we started out suggesting five steps, but our community is constantly experimenting and tweaking it to reflect the core steps that are present in every kind of data-driven projects. The steps are:
* Define: Data-driven projects always have a “define the problem you’re trying to solve” component. It’s in this stage you start asking questions and come around the issues that will matter in the end. Defining your problem means going from a theme (e.g. air pollution) to one or multiple specific questions (has bikesharing reduced air pollution?). Being specific forces you to formulate your question in a way that hints at what kind of data will be needed. Which in turns helps you scope your project: is the data needed easily available? Or does it sound like some key datasets will probably be hard to get?
* Find: While the problem definition phase hints at what data is needed, finding the data is another step, of varying difficulty. There are a lot of tools and techniques to do that, ranging from a simple question on your social network, to using the tools provided by a search engine (such as Google search operators), open data portals or a Freedom of Information request querying about what data is available in that branch of government. This phase can make or break your project, as you can’t do much if you can’t find the data! But this is also where creativity can make a difference: using proxy indicators, searching in non-obvious locations… don’t give up too soon! 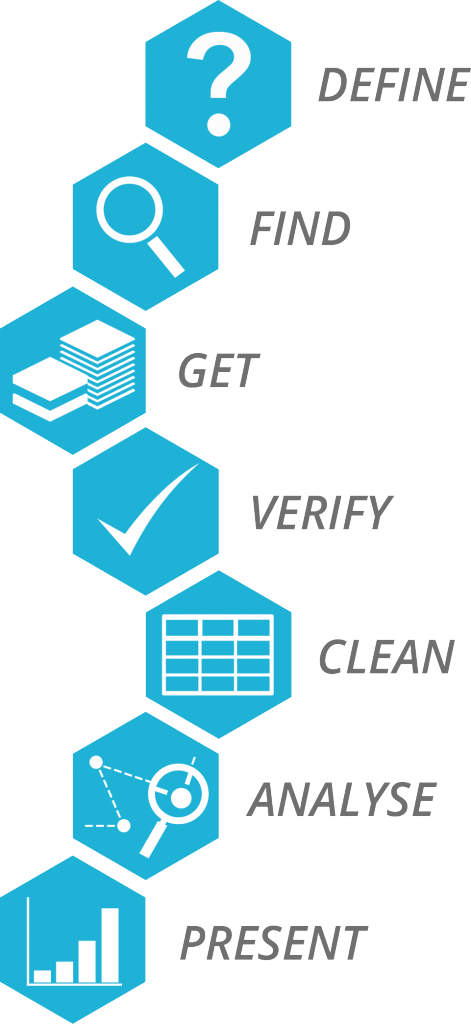
* Get: To get the data from its inital location to your computer can be short and easy or long and painful. Luckily, there’s plenty of ways of doing that. You can crowdsource using online forms, you can perform offline data collection, you can use some crazy web scraping skills, or you could simply download the datasets from government sites, using their data portals or through a Freedom of Information request.
* Verify: We got our hands in the data, but that doesn’t mean it’s the data we need. We have to check out if details are valid, such as the meta-data, the methodology of collection, if we know who organised the dataset and it’s a credible source. We’ve heard a joke once, but it’s only funny because it’s true: all data is bad, we just need to find out how bad it is!
* Clean: It’s often the case the data we get and validate is messy. Duplicated rows, column names that don’t match the records, values that contain characters which will make it difficult for a computer to process and so on. In this step, we need skills and tools that will help us get the data into a machine-readable format, so that we can analyse it. We’re talking about tools like OpenRefine or LibreOffice Calc and concepts like relational databases.
* Analyse: This is it! It’s here where we get insights about the problem we defined in the beginning. We’re gonna use our mad mathematical and statistical skills to interview a dataset like any good journalist. But we won’t be using a recorder and a notebook. We can analyse datasets using many, many skills and tools. We can use visualisations to get insights of different variables, we can use programming languages packages, such as Pandas (Python) or simply R, we can use spreadsheet processors, such as LibreOffice Calc or even statistical suites like PSPP.
* Present: And, of course, you will need to present your data. Presenting it is all about thinking of your audience, the questions you set out to answer and the medium you select to convey your message or start your conversation. You don’t have to do all by yourself, it’s good practice to get support from professional designers and storytellers, who are experts at understanding what are the best ways to present data visually and with words.
The Data Expedition
Data Expeditions are quests to map uncharted territory, discover hidden stories and solve unsolved mysteries in the Land of Data. In a team you’ll tackle a problem, answer a question or work on a data project. We help you to get started and decide on the direction you want to take then guide you through the various steps of the expedition. The various steps of the data expedition are defined after the the data pipeline, and structure your work on the project.
Two of our central philosophies are learn by doing and work with real data. Data expeditions are the truest embodiment of these philosophies. You’ll go in circles, get lost, make mistakes, and sometimes not reach your goal. But that’s fine! This is best way to get familiar with working with data. And you may even make some new friends along the way.