Many problems in formatting financial data can be time-consuming to solve. Luckily, there is a very powerful tool, OpenRefine, which can drastically speed up data cleaning. This tutorial shows you how to use OpenRefine to clear up key issues with data.
Getting set up
Install Refine
The first step is to install OpenRefine by following the instructions here:
http://openrefine.org/download.html
OpenRefine will be an application on your computer, but it will open up and run in your web browser.
Note: many users who have Windows as an operating system run OpenRefine directly from a zip file. We strongly advise against this and would suggest extracting the application into a dedicated directory.
Create a project
Now you need to upload your data to Refine. After you start Refine, it will open a browser and present its landing page. If the page does not appear automatically, you can try to open it by navigating to http://localhost:3333 in your browser. On the landing page, create a project, choose your files, and hit Next.
Before you start editing, there are a couple of changes we suggest you make to your data:
- Character encoding. Select either “ISO 8859-1” or “UTF-8”. This ensures any special characters or diacritics will be displayed correctly.
-
Parse cell text into numbers, dates, etc. We suggest de-selecting this option, as it can often cause errors to occur (e.g. confusion between American and British date formats).
Tricks and tips
OpenRefine is a spreadsheet editor built for bulk data analysis and processing. It takes a bit of getting used to, and unfortunately, it does not share many commands with familiar programs such as Excel. Certain elements of Refine are very simple to use, however.
Getting familiar with facets and filters
You will use both facets and filters very often in Refine. Try creating a text facet to understand what they do:
Click on the dropdown arrow in the column header > Facet > Text Facet
You will see a box appear which groups all identical cell contents and provides a count of the number of times they appear in that column in your dataset. This is useful for several reasons:
- Spotting typos. Creating a text facet gives you an overview of all the unique cells in a column. This means you can easily scroll through them to review. It might show you, for example, that some of your cells contain “Rroceeds from global taxes” rather than “Proceeds from global taxes”. You want to correct the former, so click edit by the facet result and edit it directly. This changes all of the cells with typos.
-
Spotting blank columns. Think a column is blank and preparing to delete it? Check quickly that there is nothing in it by performing a text facet. If the column is empty, you should get only one result (blank). You can then delete this column by clicking the Dropdown > Edit Column > Remove this Column.
Note: facets only work up to a few thousand unique entries, so if you have a very large dataset and want to find specific values in a column with many distinct values, it may be best to use a filter to search for that item individually. Select this from the column dropdown menu as before.
Fill down
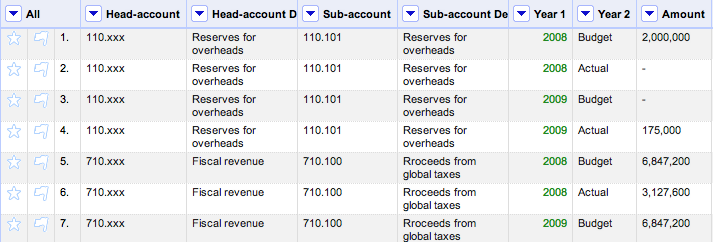
It is not uncommon for data to be produced in a way which is easy for humans to read but not easy for machines to understand. Look at the ‘Head-account’ column in the example below:
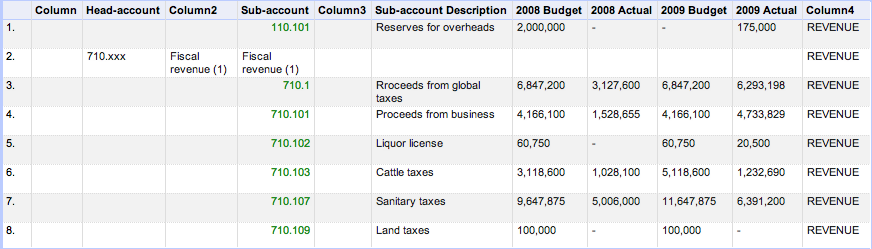
We can see that there is a relationship between the Head-account column and Sub-account. The Head-account value which is present in the second row should also “fill down” numerous rows, as all the sub-accounts fall under this category.
OpenRefine has a tool to copy the results of a cell down until it meets another entry—in this case, the next value for Head-account.
Dropdown > Edit Cells > Fill Down
Check for the correct results by performing some text facets. In this case, you will see that the cell in the top row is blank, as there was nothing to fill down from. This will have to be corrected manually.
Delete and rename columns
To delete a column, take the steps described in the section ‘Getting Familiar with Facets and Filters’ for techniques to show a column is genuinely empty, then:
Dropdown > Edit Column > Remove this Column.
You can rename a column with another command from the same menu:
Dropdown > Edit Column > Rename this Column
Removing pseudo-rows
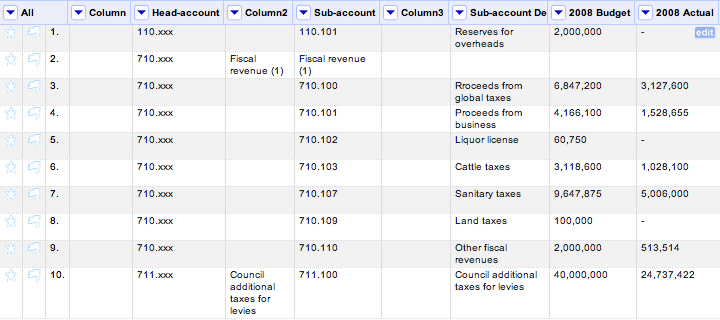
You will often find that some rows in your dataset do not actually contain any data. Row 2 in the example below, for instance, contains no data for budgeted or actual amounts for either 2008 or 2009.
This is because it is simply a placeholder row in the original document. You will often encounter “pseudo-rows” like this. To find such fake rows in this dataset, we perform a text facet on the four columns 2008 Budget, 2008 Actual, 2009 Budget, and 2009 Actual, and in each one, we select only the blank cells.
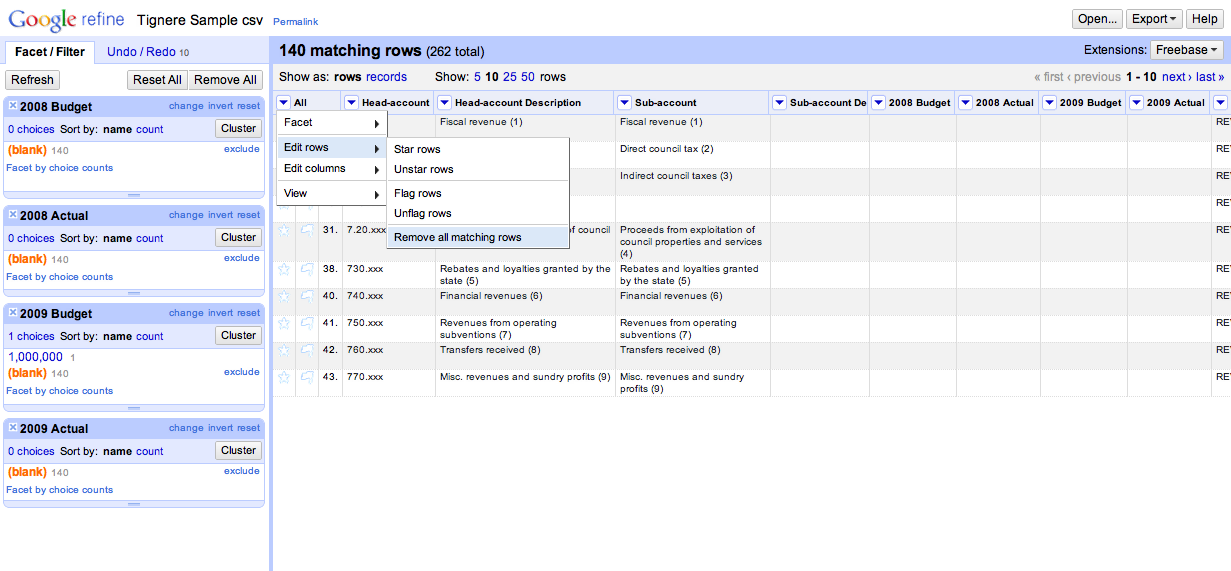
When you are done, go to the dropdown menu in the All column:
Dropdown > Edit rows > Remove all matching rows
Removing useless content from column values
You will sometimes find that the values of columns in your dataset contain content that adds visual clutter without providing additional value. In the dataset we’ve been working with in this lesson, for example, a number appears after the value in the Head-account and Sub-account columns. Extraneous content like this can be automatically removed to tidy up:
Dropdown > Edit cells > Transform
You will be taken to a screen which will ask you to input some functions in OpenRefine code. You can refer to the Help section of the dialogue box for more functions and transformations; we cover only what’s necessary here.
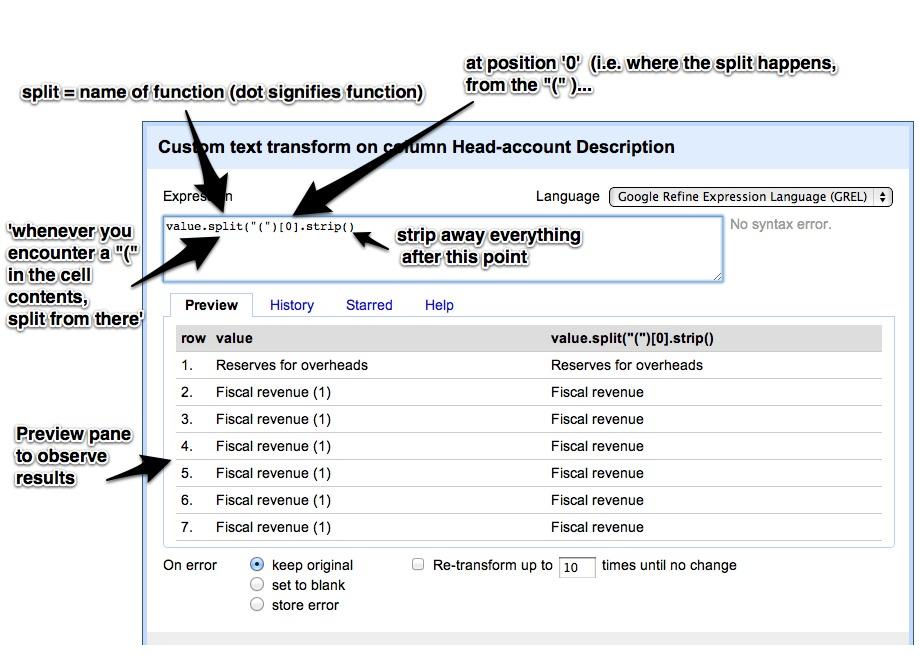
Don’t worry if you don’t understand exactly what is going on here! If you are just trying to tackle exactly the same issue, you can simply copy the code. Otherwise, consult the Help section for more details.
Transposing columns
In well-formatted data, one row must correspond to one logical piece of information. As you can see, in the dataset we’ve been working with in this lesson, we have 4 columns which correspond to time:
| 2008 Budget | 2008 Actual | 2009 Budget | 2009 Actual |
This presents an additional complication, as each of these column headers contains distinct types of information (budget vs. actual spending). We will also need to split these elements out.
To do this, we will transpose columns from the row.
Transpose
To transpose columns means to flip them 90 degrees. To start transposing columns, choose:
Dropdown > Transpose
You will then be presented with a dialogue box which will look something like this:
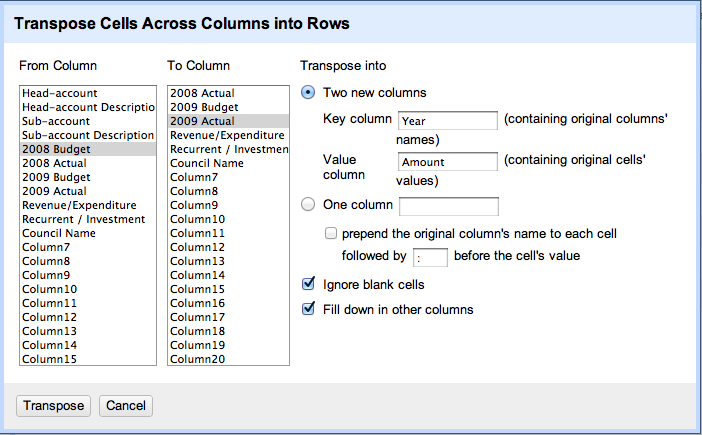
In the From Column and To Column selectors, you need to select the range of the columns you would like to transpose. From is the furthest column left of the range you are selecting, and To is the furthest right.
In this case, you are interested in two new columns, one which will contain what were previously the contents of the header row, the other which will contain the contents of the cells (the amount). Enter a name to describe the original column headers in the Key column field and a name to describe the original cell contents in the Value column field.
You should also select Fill down in other columns to ensure that the data from the existing rows is correctly replicated down the table.
The result should end looking something like this:
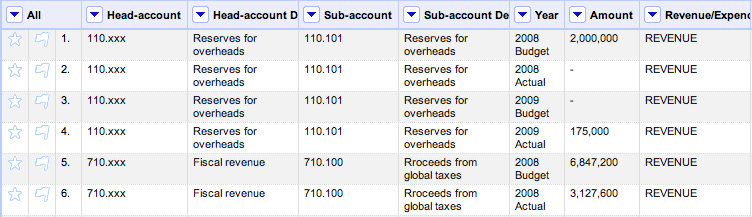
As you can see, the cells in the year column still contain information for both the year and whether the amount is budgeted or actual, so we need to split these out.
Splitting one column into many
To start splitting out budgeted and actual values, choose:
Dropdown > Edit column > Split into several columns
In the resulting dialogue box, you will be asked where the column should split, i.e. what the separator is. The column cell contents are all of the form YYYY {Budget, Actual}, with a space between the two parts of the contents, so you want to simply enter a space as the separator character.
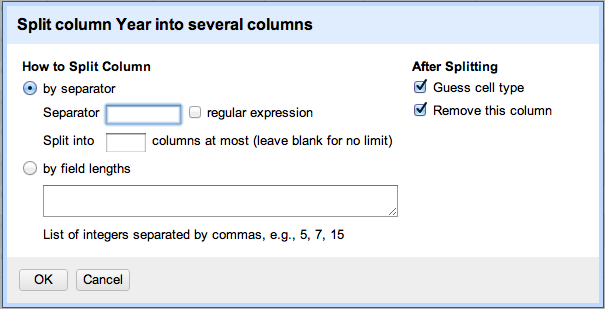
You may choose to deselect Guess Cell Type, but it’s not critical here. Hit OK.
You will end up with something which looks like this. You will need to rename the new column.
Again, it is a good idea to run a text facet over the new cells just to check that nothing has gone wrong.
Removing blank cells
As you can see, some cells still contain dashes, as there is no data for that year. This will cause problems when using the data (e.g. OpenSpending will not accept these dashes), so they must be removed.
Simply filter the column for dashes:
Dropdown > Text Filter
Enter your search term. This will bring up all of the empty columns. Remove them by selecting the dropdown in the All column.
Dropdown > Edit rows > Remove all matching rows
Clear your filter, and you will see your cleaned data.
Removing commas from numbers
In well-formatted data, numbers should not have any delimiters besides a dot to designate decimals and optionally a minus sign. In many datasets, however, commas or spaces are present in numbers as visual separators.
With OpenRefine, commas and spaces are easy to remove. OpenRefine uses an approach very similar to Removing numbers in brackets, but whereas before the command was split, here the function we run is replace. Choose the Transform command:
Dropdown > Edit cells > Transform
In the input screen, enter:
value.replace(",", "")
The contents of the first pair of quotation marks tell the program what is being replaced, and the contents of the second tell it what to replace it with (here, nothing).
Stripping whitespace
The final step will not produce any results which are immediately visible to the human eye, but it is important nevertheless. This step is stripping any remaining spaces from the ends of cells. This is important because items like “Fiscal revenue” and “Fiscal revenue ” should not be grouped separately when working with your data!
Dropdown > Edit cells > Common transforms > Trim leading and trailing whitespace
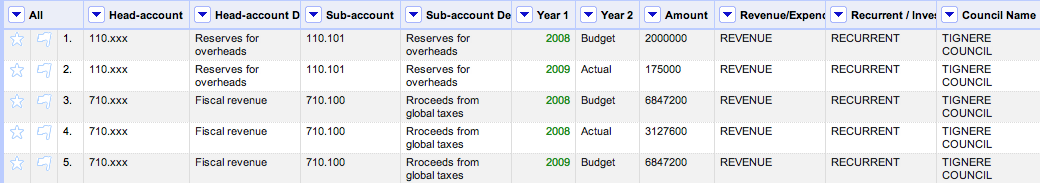
Results
When you’ve performed all of the above edits to our dataset, you end up with something like this:
Merging in data from another project/spreadsheet
One of the most powerful capabilities of OpenRefine is its ability to combine information from multiple Refine projects. Users of Microsoft Excel might know a similar function called VLOOKUP, while users of relational databases will be familiar with the idea of a JOIN. Given a shared set of values in a particular column, attributes from one table can be imported into the other, with the shared set of values forming a “pivot” between the two tables.
The project-merging function, called cross, is somewhat complex to use. It must be scripted as a command, and the code involves both the concept of a cell and various rows. Consult its documentation for further guidance.
The usefulness of cross can be illustrated with an example. Assume, for instance, that one project contains information about investment projects and has a column “Chapter” which contains a numeric identifier for the budget chapter the investment was allocated under. Another project—we’ll assume it’s called “Cameroon Budget Codes”, and actual data is available for testing—may contain more information about each chapter, such as its full title (the column “en” in the data) and its value in other classification schemes (the column “Focus Sector Codes” in the data). To merge these two datasets, open the “Chapter” column dropdown in the investment data and select “Edit column”, then “Add column based on this column…”.
The cross function is also useful when applying general transformations where you want both the original and transformed data to remain available. In the transformation code box, type the following:
cell.cross("Cameroon Budget Codes", "code_category").cells["en"].values[0]
This command, when executed, will pull in the chapter titles from the budget codes project. The first argument to cross, “Cameroon Budget Codes”, is the name of the project from which we’ll pull in our data. The next argument, “code_category”, is the name of the column which contains the chapter codes in that project.
Each value in the investment data “Chapter” column will thus have its “code_category” column searched. If a match is found, we will receive a reference to the row in which it occurred. This reference can be used to look up a specific column in the budget codes project: cells["en"] will pick the value column called “en”. Finally, any such linkage may yield multiple results: a given chapter code may occur not once but many times in the project we’re crossing with. In this example, we use .values[0] to select the first match, regardless of the total number of possible links.
After verifying the result in the preview and adding a name for the new column, pressing “OK” will add the desired values. You can repeat this for each column you want to import.
Further reading
The operations explained in this tutorial are the most common actions needed when cleaning up financial data for use with OpenSpending. OpenRefine offers a much larger set of functions for data cleaning, so it is worthwhile to browse the documentation.
In particular, we recommend learning about how to use the clustering functions on manually created and messy datasets as well as how to use the web retrieval options to add further attributes to a table from an external source.