Modules Objectives
- Learn the basics of Timemapper as a storytelling tool
Prerequisites
- A Google account to use Google spreadsheets
-
A Twitter to account to login and save your timemap
Introduction
Journalists get to work on complex stories that sometimes can not be written in a simple, precise and easily understandable manner if only text is used. Understanding these complex stories can represent a challenge for the audience, which is why journalists use more than one digital storytelling tools to tell the story. In that way the reader is not overwhelmed and his attention is kept.
When a complex story includes chronological data that span through a long period of time and includes numerous events, the best way to interpret it is through an interactive timeline. There are a number of online tools that exist out there which can help you with preparing timelines, but Timemapper Js and Timeline Js are open source tools that are easiest to use and give professional look to your data.
Timeline.Js was created by the Northwestern University’s Knight Lab, led by associate professor Zach Wise, former award winning multimedia producer at the NY Times. So far it was used by many news organizations to visualise stories.
Timemapper was built by Open Knowledge Foundation Labs and it further extends the functionality of TimelineJs with the option to add geographical data that can be displayed on a map. This makes it a mapping tool as well. Also, it allows users to create an account or sign in with their existing twitter account. This provides a stable URL and lists all Timelines, Timemaps or Maps created by single account.
The online tool is free to use and can give very important context to the story by linking it to different times and spaces, showing the relations between events that might seem unrelated and helps the narrative of the story.
Besides journalism, Timemapper can be used as a teaching or training tool for various audiences. It can very successfully present historical data connected to different locations. It can also be used by civil society representatives, especially in collaborative projects that include several countries, environmental projects, as a way to present internal reports etc.
Timemapper can be used to produce three kinds of projects: Timelines (very similar to the ones produced with TimelineJs), Timemaps (that include a map along the Timeline) and just a Map.
More details, as well as the open source code, can be found on the github page.
Using Timemapper
How to start
Timemapper is a very easy to use tool, that can be utilized in minutes depending on the amount of data.
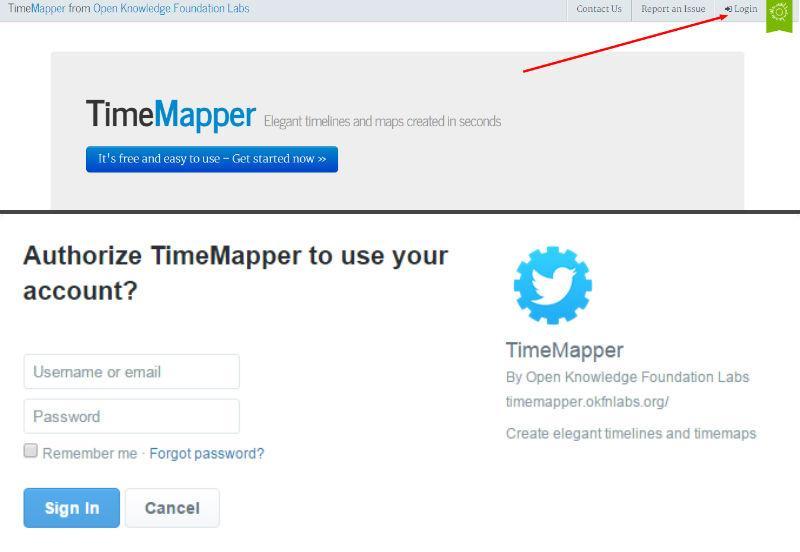
- Sign in at: http://timemapper.okfnlabs.org/account/login which can be done with your twitter account. You can also create a Timemap anonymously but won’t have the benefits of a custom URL and list of all your timemapper projects with the option to delete them.
-
In order to start your first project click Create a new Timeline or TimeMap.
Working with the Timemapper template
Timemapper generates the projects from a simple Google spreadsheet, therefore you have to:
- Add the data you want to present in a pre-prepared Timemapper Template.
-
After you make a copy of this template, start adding your data.
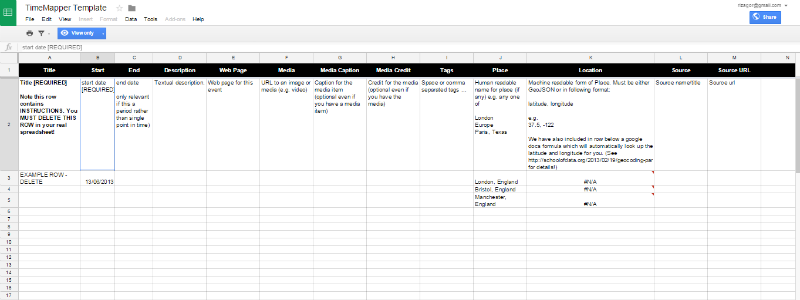
The template is self-explanatory – in the second row there is an explanation of the meaning for each of the columns the tool understands. In fact, you don’t have to use all of the columns for a Timemap, only the Start date, the Title, a Description and the geographical coordinates for the map.
It’s useful to add data in these columns that are included in the template:
- Media where you can embed pictures, tweets, video from Vimeo, Youtube, etc. simply by copying their URL;
-
Caption that explains the picture, video, tweet and gives context;
-
Credit for the author or owner of the media;
-
Web Page that can be generated also by copy pasting the url.
-
End date of each event can be added to show the time span along with the descriptive
-
Tags and
-
Source of the added media or information.
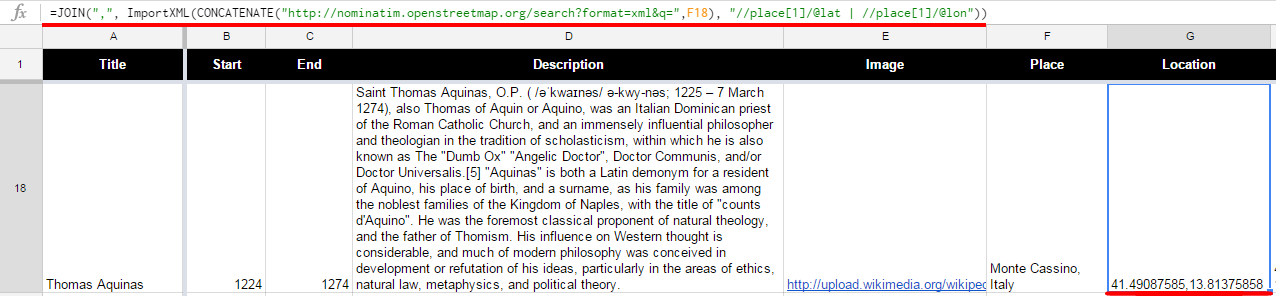
When it comes to adding the Place and Location columns, which are generated as a graphical map in the final product, there is more than one way to do it. The location must be entered in the latitude, longitude format. If you have data that includes the city of Nassau in the Bahamas in it, the content of the Place column would be Nassau, Bahamas and for the Location column would need to be: 25.047984, -77.355413 for latitude and longitude.
- One way to do this is by manually copy-pasting the latitude and longitude coordinates one by one in the Location_Original column. Of course, you would have to find them via some of the existing geocoding services (for example http://www.gps-coordinates.net/ or http://latlong.net). This means copying or typing the places or addresses one by one and finding their coordinates in latitude, longitude format so the mapping can work.
-
The second way is through the already included ImportXML formula in the Location column. The formula automatically determines the latitude and longitude of any given place or address in the Place column as shown in the picture below. The formula grabs the latitude and longitude data in precisely that format from an online geocoding service that recognizes the data you have in your data set.
-
The third way is for more advanced users and requires installation of Google App Script. For more info on the formula take a look at this blog post.
Publishing your timemap
After you’ve added the data, your timemap is ready to be visualised. You do this first by publishing your Google spreadsheet to the web which would make it visible to everyone and ready to be embedded onto your website:
- go to File – Publish to the web and click on Start publishing. Although you have published your Timemap by doing this, it is still not reachable for everyone in the expected format.
-
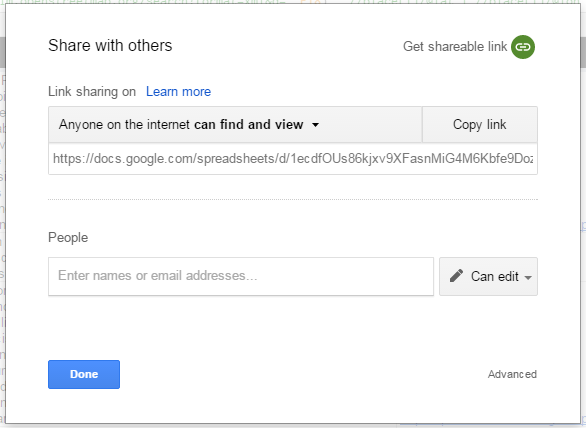
After that click done and go to the upper right corner of the Google Sheets page and click Share. As shown on the picture below, you need to select the Anyone with the link can view, or Anyone on the internet can find and view option.
- After you copied the URL, paste it onto the Timemapper page or select the spreadsheet from your Google Drive. On this page you can give your Timemap a title, make a custom URL and select if you want to show a Timeline, a Timemap or just a Map depending on your data. You can also choose if you want your timemap to start from the first, the last or the present day.
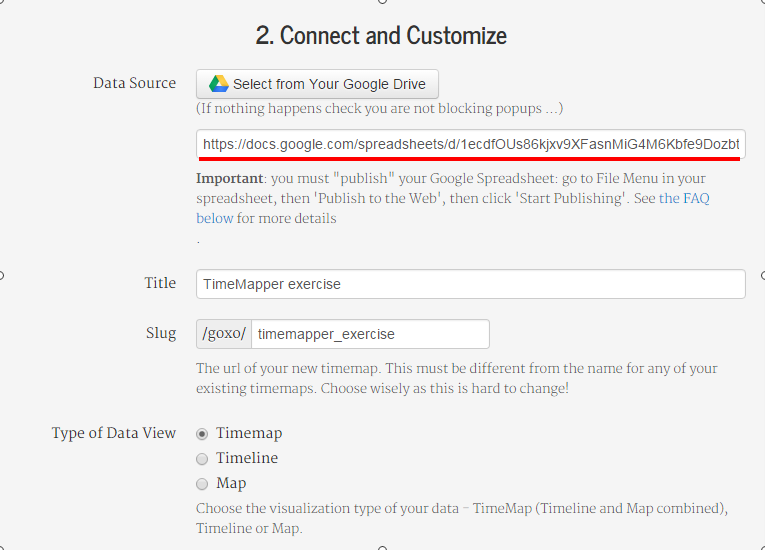
-
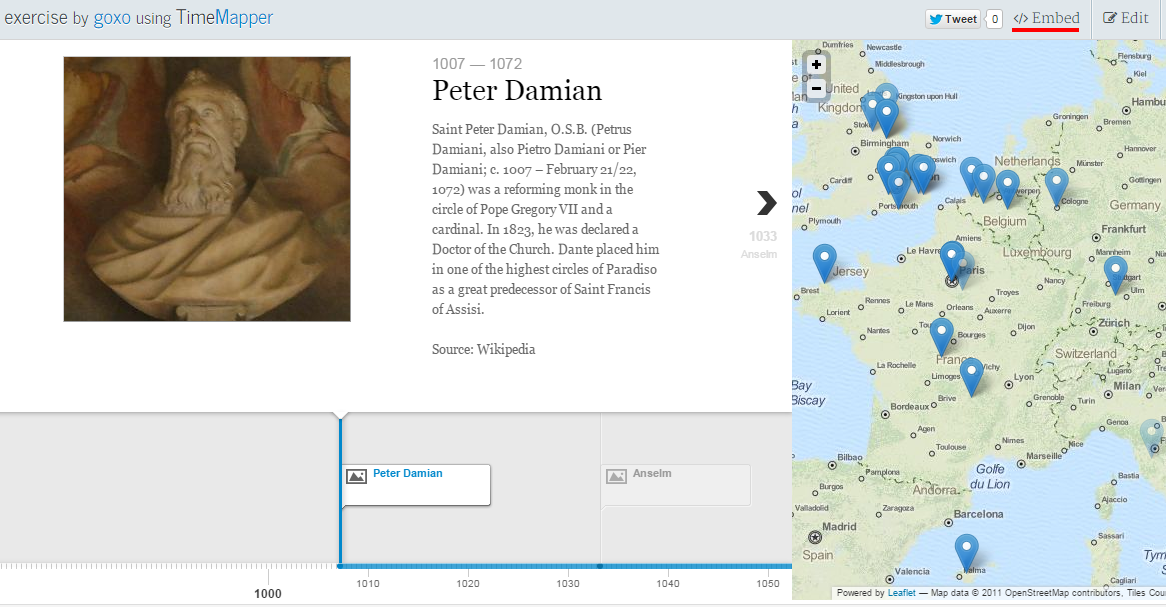
Click Publish and you’ll be automatically redirected to your Timemap. In order to get your HTML code and insert the project to a website, click embed and copy paste the code into your own website’s code.
Advanced use of Timemapper
Advanced users that would like to use polygons or boundaries of countries to the map in Timemapper rather than using points need to build GeoJSON boundaries or objects. For more info on geocoding in Google docs take a look at this post.
Limitations of Timemapper
One limitation is that Timemapper doesn’t have many customization options, especially concerning the maps and it relies on Google Sheets.
Second, the ImportXML formula used to grab data from a geocoding service is limited to 50 rows at one time so if you have big data-sets this can be time consuming.
The data you have might not correspond with the Timemapper format if the dates are uncertain, or you want to have a custom made map and timeline. If that is the case, you can choose an online tool which best suits you data and is most helpful in visualising your story or project.