Introduction
Once you have cleaned and filtered your dataset – it’s time for analysis. . Analysing data helps us to learn what our data might mean and helps us to extract answers to our questions from the dataset.
Look at the data we imported. (In case you didn’t finish the previous tutorial, don’t worry. You can copy a sample spreadsheet here).
This is World Bank data containing GDP, population, health expenditure and life expectancy for the years 2000-2011. Take a moment to have a look at the data. It’s pretty interesting – what could it tell us?
- Task:
- Brainstorm ideas. What could you investigate using this data?
Here are some ideas we came up with:
- How much (in USD) is spent on healthcare in total in each country?
- How much (in USD) is spent per capita in each country?
- In which country is the most spent per person? In which country is the least spent? What is the average for each continent? For the world?
- What is the relationship between public and private health expenditure in each country? Where do citizens spend more (private expenditure)? Where does the state spend more (public expenditure)?
- Is there a relationship between expenditure on healthcare and average life expectancy?
- Does it make any difference if the expenditure is public or private?
- NOTE:
- With these last two questions, you have to be really careful. Even if you find a connection, it doesn’t necessarily mean that one caused the other! For example: imagine there was a sudden outbreak of the plague; it’s not always fatal, but many people who contract it will die. Public healthcare expenditure might go up. Life expectancy drops right down. That doesn’t mean that your healthcare system has suddenly become less efficient! You always have to be REALLY careful about the conclusions you draw from this kind of data… but it can still be interesting to calculate the figures.
There are many more questions that could be answered using this data. Many of them relate closely to current policy debates. For example, if my country were debating its healthcare spending right now, I could use this data to explore how spending in my country has changed over time, and begin to understand how my country compares to others.
Formulas
So let’s dive in. The data we have is not entirely complete. At the moment, healthcare expenditure is only shown as a percentage of GDP. In order to compare total expenditure in different countries, we need to have this figure in US Dollars (USD).
To calculate this, let’s introduce you to spreadsheet formulas.
Formulas are what helped spreadsheets become an important tool. But how do they work? Let’s find out by playing with them…
- Tip:
- Whenever you download a dataset, the very first thing you should do is to make a copy of it. Any changes you should make should be done in this copy – the original data should remain pure and untouched! This means that you can go back and check it at any time. It’s also good practice to note where you got your data from, when and how it was retrieved.
Once you have your own copy of the data (try adding ‘working copy’ or similar after the original name), create a new sheet within your spreadsheet. This is for you to mess around with whilst you learn about formulae.
Now move across to the “Total fruits sold” column. Start in the first row. It’s time to write a formula…
Walkthrough: Using spreadsheets to add values.
Using this example data. Let’s calculate the total of fruits sold.
Get the data and create a working copy.
To start, move to the first row.
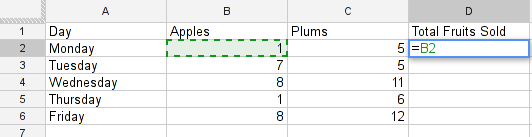
Each formula in a spreadsheet starts with =
Enter = and select the first cell you want to add. Notice how the cell reference appears in the formula?
now type + and select the second cell you want to add
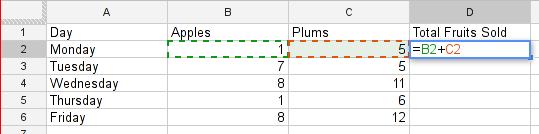
Press Enter or tab .
The formula disappears and is replaced by the value.
Try changing the number in one of the original cells (apples or plums) you should see the value in total update automatically.
You can type each formula individually, but it also possible to cut and paste or drag formulas across a range of cells.
Copy the formula you have just written (using ctrl + c ) and paste it into the cell below (using ctrl + v ), you will get the sum of the two numbers on the row below.
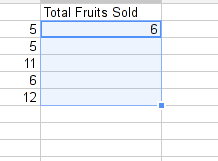
Alternatively click on the lower right corner of the cell (the blue square), and drag the formula down to the bottom of the column. Watch the ‘total’ column update. Feels like magic!
Task: Create a formula to calculate the total amount of apples and plums sold during the week.
Did you add all of the cells up manually?: That’s a lot of clicking – for big spreadsheets, adding each cell manually could take a long time. Take a look at the “spreadsheet formulae” section in the Handbook – can you see a way add a range of cells or entire columns simply?
Where Next?
Once you’ve got the hang of building a basic formula – the sky is your limit! The School of Data Handbook will additionally walk you through:
- Multiplication using spreadsheets
- Division using spreadsheets
- Copying formulae sideways
- Calculating minimum and maximum values
- Dealing with empty cells in your data (complex formulae). This stage uses Boolean logic .
You may need to refer to these chapters to complete the following challenges.
Multiplication and division challenge
Task: Using the data from the World Bank (if you don’t have it already, download it here.). In the data we have figures for healthcare only as a % of GDP. Calculate the full amount of private health expenditure in Afghanistan in 2001 in USD. If your percentages are rusty – check out the formulae section in the Handbook.
Task: Still using the World Bank Data. Find out how much money (USD) is spent on healthcare per person in Albania in 2000.
Task: What is the formula for healthcare expenditure per capita? Can you modify it so it’s only calculated when both values are present (i.e. neither cell is blank)?
Summary & Further Reading
In this module we had an in depth view on analysis. We explored our dataset looking at the range of data. We further took a leap into conditional formulas to handle missing values and developed a quite complex formula step by step. Finally we touched on the subject of normalizing data to compare entities.
Take the following quiz to check your analysis skills.
Last updated on Sep 02, 2013.