Even the Simplest Data Needs Cleaning Sometimes… A (Slightly Broken?!) Example Using Google Spreadsheets
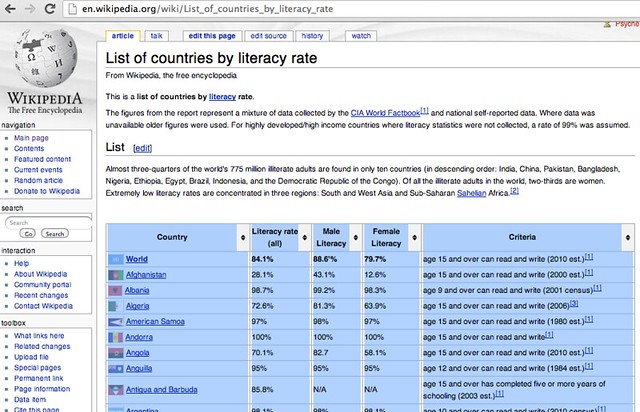
Once a week, Google’s search anthropologist Dan Russell posts a search related challenge to his SearchReSearch blog. This week’s challenge revolved around finding, and then visualising, literacy rates from around the world. In the answer to the question, Dan identified one source of the data as a Wikipedia page (List of countries by literacy rate), noting that “you can copy/paste the entire table into a text editor, and with a few passes, you can convert it into a nice CSV for importing into your favorite spreadsheet or visualization tool for analysis”.
Being able to see how to tidy a data set is something that can frustrate many data users. Looking at the data, we see several issues with the data set:
- the percentages are listed as such, rather than as numbers in a column with units of per cent. Many tools will see this sort of representation as a character string rather than as a number-with-units, so we need to tidy it a little to remove the percentage sign in each cell;
- some of the percentage cells contain “not available” or “not applicable” identifiers. In a spreadsheet, we might prefer to treat these as empty cells;
- the column that describes what the literacy figure actually relates to. The way this information is phrased seems to have a standard form in many cases, which we might be able to use to create a column with new units (for example, age up to and over which population can read and write), or containing information about the year the data was sampled.
So how can we go about grabbing the data and cleaning it up a little?
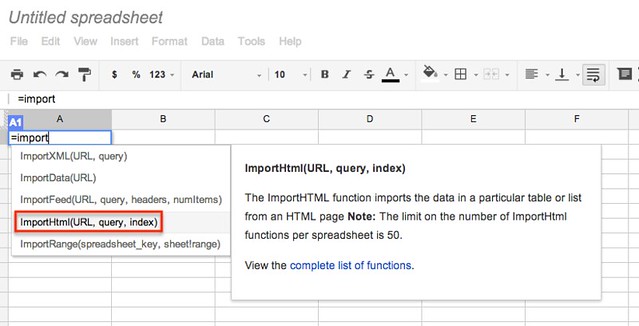
One way is to use Google Spreadsheets. As Dan suggests, we can do this simply by highlighting the table cells, copying them, and then pasting them into a spreadsheet programme such as Excel or Google Spreadsheets. We can also automate the collection using a special Google Spreadsheets formula that can extract a table from a web page given the pages web address/URL, and the number of the table in the page (sometimes you have to guess at this!)
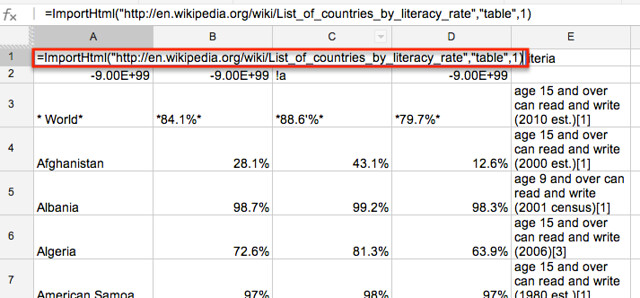
Here’s what happens when we add the Wikipedia page URL and tell the formula to grab table number 1:
(This also represents a simple form of a datawrangling technique known as screenscraping.)
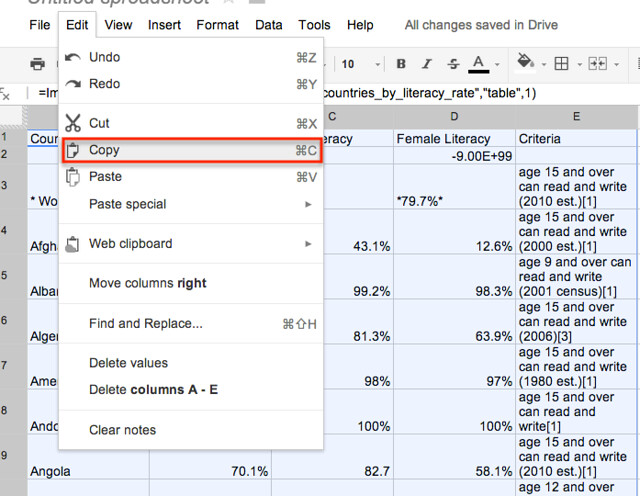
If we’d just copied and pasted the table directly into the spreadsheet, we would have been able to start tidying it straight away. However, because we used a formula, the cells don’t contain raw values, so we can’t start to edit them (just try it…). Instead, we have to take the cells values and paste them into a new sheet as values, whence we cans start to work on them. So highlight the cells, copy them:
create and select a new sheet, and paste special using values only:
The first bit of tidying we might do is get rid of the clunky line 2:
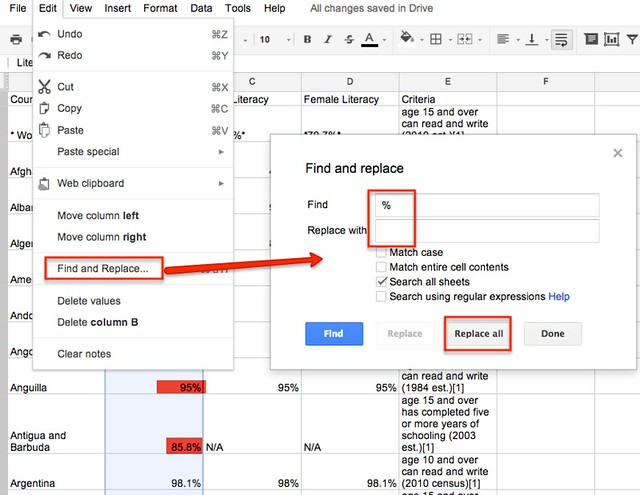
Then we might start to tidy up the columns where the numerical cells contain percentage signs:
(We should probably also add the % units to the corresponding column header at this point.)
That seems to have worked… (though as we shall see, it may have worked too well…).
We can also do more powerful search and replace operations, using a class of operators known as “regular expressions”. These operators allow you to use special symbols to define patterns in a piece of text that you can search on, and replace (or in more elaborate regular expression engines, extract into a result). One of the most commonly used regular expressions is the pattern .*, which we read as “any character” (the .) “any number of times” (the *):
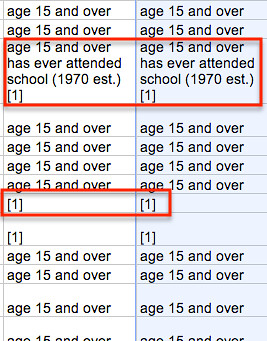
Here’s what happens if we apply that operator as shown above to a copy of the Criteria column:
(Do you notice anything odd? I missed it at first…)
It seems to have worked in most cases (or has it?!), although for some cells the find and replace appears not to have worked (can you work out why?). Sometimes, we may need to tweak our regular expression, or run several search and replace operations using different regular expressions, to completely tidy a dataset so that it suits our purposes. Do you think you could tweak the expression to show just the age (and over) that the criteria applies to? Could you create a column that captures the year the data element was reported?
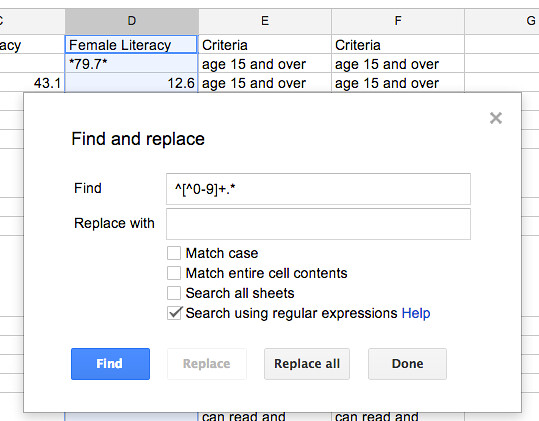
Sometimes spreadsheet menu operations don’t work quite as we might expect them to. For example, I assumed that if I highlighted a column and then applied the Search and Replace, it would only cover the highlighted cells. That’s what I assumed above, and once again here. Here’s what I tried – a regular expression that tries to find and replace with nothing cells that start with something that isn’t a digit:
This is quite cryptic, isn’t it?! Let’s unpack it: the first ^ says: “the cell value should start with”; if we immediately followed this with [0-9] it would then say “a digit 0-9”; the + says “at least one (or more) of the preceding thing” (that is, digits in the range 0 to 9); the .* then says “any number of any characters”. However, we’ve tweaked this a little to replace [0-9] with [^0-9], which reads “not a digit in the range 0-9″. So overall, ^[^0-9]+.* looks for a cell whose contents have a pattern that starts with at least one character that is not a digit in the range 0 to 9, followed by any number of arbitrary characters.
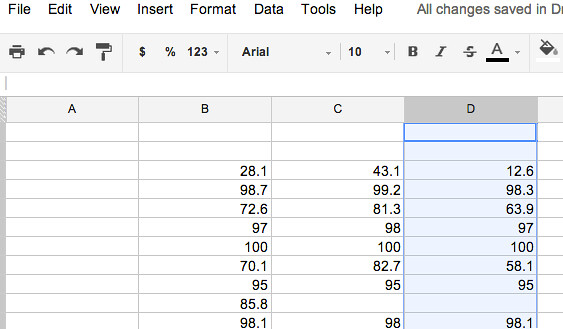
And the result?
Oops – it’s been applied to the whole sheet. (And if you check back you’ll see this also meant I replaced all the percentage signs, and did a replace operation on the original Criteria column as well as the copy of the column that I thought I’d limited the search and replace to by highlighting it!) Don’t worry though- we haven’t broken the web. And at least we can undo the changes:
(The undo operation is also available from the Edit menu, or the cmd-z/ctrl-z keyboard shortcut.)
To work around this sheet-wide search and replace, one approach we might take to focus the operation a little more might be as follows: copy the column we want to apply a search and replace to into a third sheet so that it’s all on it’s own, tidy it up there, then copy the result back into the current sheet.
So there we have it, some quick tricks (though with clunky workarounds required!) to get you started with obtaining and cleaning a data set so we can start to use it with other tools, such as visualisation tools. There are a few caveats to bear in mind though:
- The =importHtml() formula is very powerful, but it can also be a little brittle (for example, it may choke when importing some tables).
- If the table on the Wikipedia page we’re referencing changes and we open or refresh the sheet, the data will update accordingly in the spreadsheet. However, the data we copied by value into the second sheet will not be updated accordingly…
- search and replace appears to operate sheet wide – which means if we want to treat just a particular column, we may need to copy it over to another sheet and work on it there before pasting it back into our “clean data” sheet.
- If we apply lots of cleaning stages to the data, we may forget what we have done (and may even introduce errors if we are unwary). A best practice approach would be to make a copy of the original data (and preserve it in this case, where the import sheet may change if the original WIkipedia page changes); use a working copy of the data as the basis for cleaning; keep a record of all the cleaning steps you applied in the order you applied them; keep a copy of the final, cleaned data set.
Whilst cleaning data in this way is one way of tidying a dataset, it’s not necessarily the most efficient or reliable way, however. For that, you may choose to use a more powerful tool, such as OpenRefine.
For an example of how to clean this data set using the specialised data cleansing tool OpenRefine, see OpenRefine/LODRefine – A Power Tool for Cleaning Data. For more examples of data cleansing recipes in general, see the School of Data blog how to category on data cleaning.

