An Expedition into Tanzanian Waterpoints
Recently our Fellow Ketty, David from Code For Africa and Michael spend a week in Tanzania. While their main task was to work with the Ministry of Water they decided to host a Data Expedition on their last day – diving with others into the data that was available. Here’s what they did:
On Friday morning a mixed crowd of approximately 15 people met us at the Buni innovation space – run by the TanzICT project. We’ve split into groups and had a good look at the data – figuring out what it contains and what we can do with it. While one group decided to look whether there is a relationship between political affiliations of MPs and waterpoint construction, the other went ahead to do some mapping using QGIS.
Figuring out MP affiliations based on constituencies is not hard – interestingly the governing party holds a lot of seats. However, figuring out how constituencies really map to waterpoints is a hard task. There are no official boundaries for constituencies – so we couldn’t map the points and count the newly constructed points in each constituency. Also: there is no ward – constituency mapping (e.g. these wards belong to this consituency). The only thing we could get (from the national election committee) was a mapping of constituencies by region. By this point we realized the data we got is not good enough to do a proper analysis. Nevertheless, we did some scraping and a good introduction to descriptive statistics using stata (done by a participant who knew how to deal with it)
The mapping topic was inspired by people who wanted to learn more about mapping software. They were jointly running a project to map farmland plot ownership across Tanzania. We came to a conclusion that although, there was no official dataset detailing farmland plot ownership in Tanzania, the water point locations can still be mapped to farmland plots in the future since availability of water is an important part of farm activities- this was a shot at being inclusive!
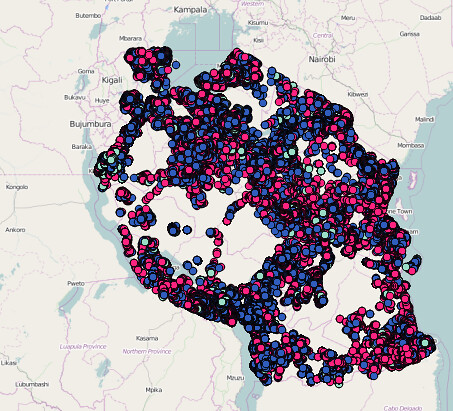
We decided to use the Tanzania water dataset to demonstrate how they might use QGIS in their project while at the same time learning more about Tanzania waterpoints. We answered questions like:
How many water points are functional, non functional or need repair in the the country?
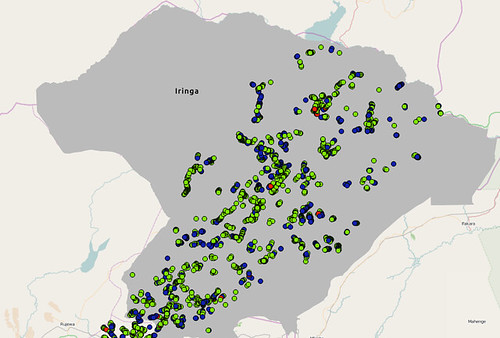
But thought it better to answer the question at a smaller administrative scale like the Iringa region to have more detailed analysis.
We also thought knowing only the number of functional water points alone might not be enough, so why not compare it with the population served? We visualised this on a map in QGIS.
Key
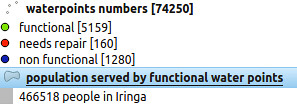
At a glance from the map, we noticed there are no water points in the Western part of Iringa region but also that on average, one functional water point serves 100 people, from the ratio 5159:466518 also ratio of number of functional water points in Iringa to population served by functional water points.
We rounded the day of with David doing an extensive presentation and workshop on visualizing some of the data using fusion tables and showing some of code for africas past projects. Digging deeper into ideas what can be done with similar data.
Overall, the day was insightful and the participants were interested and happy to have exploration of public data happening in Tanzania. We concluded with eager discussions and sharing our experience and outlooks on the Open Data process in Tanzania (it’s on the way – we’ll need some patience but it is happening). Special thanks to the Buni innovation space and TanzICT for hosting us!
![]()