The Data Journalism Bootcamp at AUB Lebanon
Data love is spreading like never before. Unlike previous workshops we did in the MENA region, on the 18th of January 2015, we gave an intensive data journalism workshop at the American University of Beirut for four consecutive days in collaboration with Dr. Jad Melki, Director of media studies program at AUB. The Data team at Data Aurora were really happy sharing this experience with students from different academic backgrounds, including media studies, engineering or business.
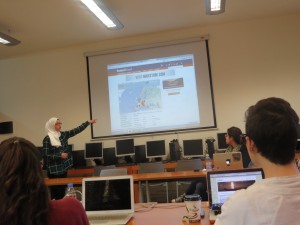
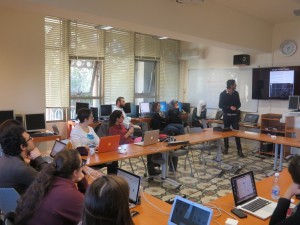
The workshop was mainly led by Ali Rebaie, a Senior School of Data fellow, and Bahia Halawi, a data scientist at Data Aurora, along with the data community team assistants; Zayna Ayyad, Noor Latif and Hsein Kassab. The aim of the workshop was to give the students an introduction to the world of open data and data journalism, in particular, through tutorials on open source tools and methods used in this field. Moreover, we wanted to put students on track regarding the use of data.
On the first day, the students were introduced to data journalism, from a theoretical approach, in particular, the data pipeline which outlined the different phases in any data visualization project: find, get, verify, clean, analyze and present. After that, students were being technically involved in scraping and cleaning data using tools such as open refine and Tabula.
Day two was all about mapping, from mapping best practices to mapping formats and shapes. Students were first exposed to different types of maps and design styles that served the purpose of each map. Moreover, best mappings techniques and visualizations were emphasized to explain their relative serving purpose. Eventually, participants became able to differentiate between the dot maps and the choropleth maps as well as many others. Then they used twitter data that contained geolocations to contrast varying tweeting zones by placing these tweets at their origins on cartodb. Similarly, they created other maps using QGIS and Tilemill. The mapping exercises were really fun and students were very happy to create their own maps without a single line of code.
On the third day, Bahia gave a lecture on network analysis, some important mathematical notions needed for working with graphs as well as possible uses and case studies related to this field. Meanwhile, Ali was unveiling different open data portals to provide the students with more resources and data sets. After these topics were emphasized, a technical demonstration on the use of network analysis tool to analyze two topics was performed. Students were analyzing climate change and later, the AUB media group on Facebook was also analyzed and we had its graph drawn. It was very cool to find out that one of the top influencers in that network was among the students taking the training. Students were also taught to do the same analysis for their own friends’ lists. Facebook data was being collected and the visualizations were being drawn in a network visualization tool.
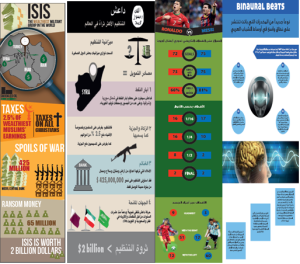
After completing the interactive types of visualizations, the fourth day was about static ones, mainly, infographics. Each student had the chance to extract the information needed for an interesting topic to transform it into a visual piece. Bahia was working around with students, teaching them how to refine the data so that it becomes simple and short, thus usable for building the infographic design. Later, Yousif, a senior creative designer at Data Aurora, trained the students on the use of Photoshop and illustrator, two of the tools commonly used by infographic designers. At the end of the session, each student submitted a well done infographic of which some are posted below.
After the workshop Zayna had small talks with the students to get their feedback and here she quoted some of their opinions:
“It should be a full course, the performance and content was good but at some point, some data journalism tools need to be more mature and user-friendly to reduce the time needed to create a story,” said Jad Melki, Director of media studies program at AUB, “it was great overall.”
“It’s really good but the technical parts need a lot of time. We learned about new apps. Mapping, definitely I will try to learn more about it,” said Carla Sertin, a media student.
“It was great we got introduced to new stuff. Mapping, I loved it and found it very useful for me,” said Ellen Francis, civil engineering student. “The workshop was a motivation for me to work more on this,” she added, “it would work as a one semester long course.”
Azza El Masri, a media student, is interested in doing MA in data journalism. “I like it I expected it to be a bit harder, I would prefer more advanced stuff in scraping,” she added.

