Easy Access to World Bank and UN Development Data from IPython Notebooks
Although more and more data is being published in an open format, getting hold of it in a form that you can quickly start to work with can often be problematic. In this post, I’ll describe one way in which we can start to make it easier to work with data sets from remote data sources such as the World Bank, the UN datastore and the UN Population division from an IPython Notebook data analysis environment.
For an example of how to run an IPython Notebook in a Chrome browser as a browser extension, see Working With Data in the Browser Using python – coLaboratory. Unfortunately, of the wrappers described in this post, only the tools for accessing World Bank Indicators will work – the others currently require libraries to be installed that are not available within the coLaboratory extension.
The pandas Python library is a programming library that provides powerful support for working with tabular datasets. Data is loaded into a dataframe, the rows and columns of which can be manipulated in much the same way as the rows or columns of a spreadsheet in a spreadsheet application. For example, we can easily find the sum of values in a column of numbers, or the mean value; or we can add values from two or more columns together. We can also run grouping operations, a bit like pivot tables, summing values from all rows associated with a particular category as described by a particular value in a category column.
Dataframes can also be “reshaped” so we can get the data into a form that looks like the form we want to be.
But how do we get the data into this environment? One way is to load in the data from a CSV file or Excel spreadsheet file, either one that has been downloaded to our desktop, or one that lives on the web and can be identified by a URL. Another approach is to access the data directly from a remote API – that is, a machine readable interface that allows the data to be grabbed directly from a data source as a data feed – such as the World Bank indicator data API.
On most occasions, some work is needed to transform the data received from the remote API into a form that we can actually work with it, such as a pandas dataframe. However, programming libraries may also be provided that handle this step for you – so all you need to do is load in the programming library and then simply call the data in to a dataframe.
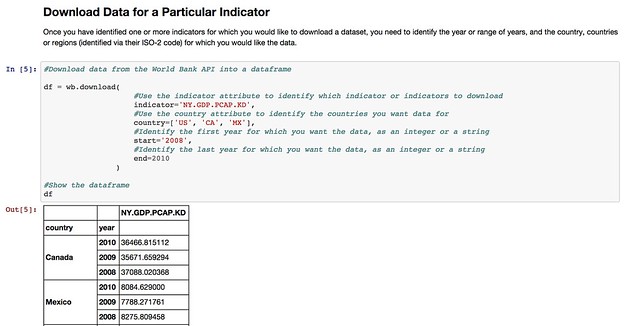
The pandas library offers native support for pulling data from several APIs, including the World Bank Development Indicators API. You can see an example of it in action in this example IPython notebook: World Bank Indicators API – IPython Notebook/pandas demo.
Whilst the World Bank publishes a wide range of datasets, there are plenty of other datasets around that deal with other sorts of development related data. So it would be handy if we could access data from those sources just as easily as we can the World Bank Development Indicators data.
In some cases, the data publishers may offer an API, in which case we can write a library a bit like the pandas remote data access library for the World Bank API. Such a library would “wrap” the API and allow us to make calls directly to it from an IPython notebook, getting the data back in the form of a pandas dataframe we can work with directly.
Many websites, however, do not publish an API – or occasionally, if they do, the API may be difficult to work with. On the other hand, the sites may publish a web interface that allows us to find a dataset, select particular items, and then download the corresponding data file so that we can work with it.
This can be quite a laborious process though – rather than just pulling a dataset in to a notebook, we have to go to the data publisher’s site, find the data, download it to our desktop and then upload it into a notebook.
One solution to this is to write a wrapper that acts as a screenscraper, which does the work of going to the data publisher’s website, find the data we want, downloading it automatically and then transforming it into a pandas dataframe we can work with.
In other words, we can effectively create our own ad hoc data APIs for data publishers who have published the data via a set of human useable webpages, rather than a machine readable API.
A couple of examples of how to construct such wrappers are linked to below – they show how the ad hoc API can be constructed, as well as demonstrating their use – a use as simple as using the pandas remote data access functions show above.
- The UN Department of Social and Economic Affairs Population Division on-line database makes available a wide range of data relating to population statistics. Particular indicators and the countries you require the data for are selected from two separate listboxes, and the data is then downloaded as a CSV file. By scraping the contents of the list boxes, we can provide a simple command based interface for selecting a dataset containing data fro the desired indicators and countries, automatically download the data and parse it into a pandas dataframe: UN Population Division Data API.
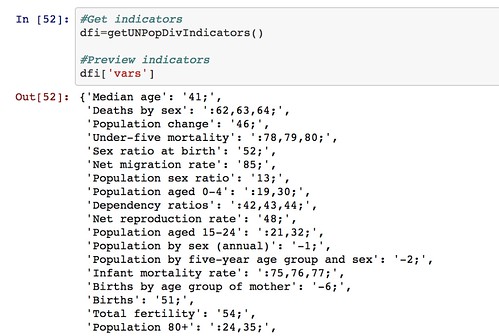
So for example, we can get a list of indicators:

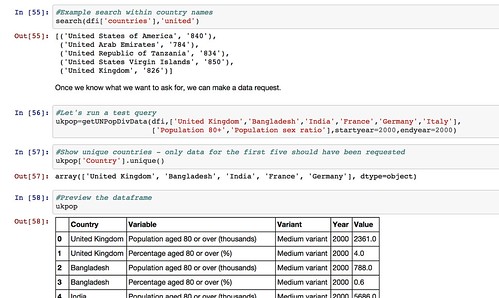
We can also get a list of countries (that we can search on) and then pull back the required data for the specified countries and indicators.
Note that the web interface limits how many countries and indicators can be specified in any single data download request. We could cope with this in our ad hoc API by making repeated calls to the UN website if we want to get a much wider selection of data, aggregating the results into a a single dataframe before presenting them back to the user.
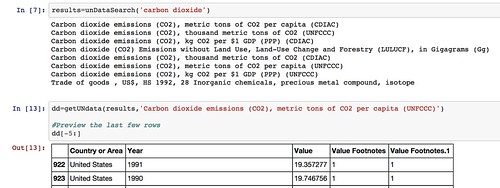
- The UNdata website publishes an official XML API, but I couldn’t make much (quick) sense of it when I looked at it, so I made a simple scraper for the actual website that allows me to request data by searching for an indicator, pulling back the list of results, and then downloading the data I want as a CSV file from a URL contained within the search results and parsing it into a pandas dataframe: UNdata Informal API.
By using such libraries, we can make it much easier to pull data into the environments within which we actually want to work with the data. We can also imagine creating “linked” data access libraries that can pull datasets from multiple sources and then merge them together – for example, we might pull back data from both the World Bank and the UN datastore into a single dataframe.
If there are any data sources that you think are good candidates for opening up in this sort of way, so that the data can be pulled more easily from them, please let us know via the comments below.
And if you create any of your own notebooks to analyse the data from any of the sources described above, please let us know about those too:-)


