You are browsing the archive for Laura Newman.

From Laura to Lucy

- October 15, 2012 in Uncategorized

In this post, Laura says farewell to her formal role with the School of Data – and welcomes Lucy Chambers, new Project Coordinator Extraordinare.

As some of you may already have heard, my time at the Open Knowledge Foundation is coming to an end. After an amazing year, I am now moving on to take up a position working on the EU Environment Portfolio in DEFRA’s European Strategy and Engagement Team. This is a fantastic opportunity and I’m very excited, but I know how much I’m going to miss devoting my days (and some of my nights!) to the School of Data.

Two things make it all better. Firstly – I have a feeling that the School of Data and the Open Knowledge Foundation aren’t the kind of places that you ever really leave. Secondly – I’m handing over to Lucy Chambers, who is incredibly awesome.

Lucy (right) and I in India for an OpenSpending Workshop and the first ever School of Data workshop.

Lucy has been working at the Open Knowledge Foundation for the past eighteen months on a variety of projects, including OpenSpending, the Data Journalism Handbook and several community initiatives particularly surrounding Open Government Data. Throughout all of this, she has gathered a lot of relevant experience helping NGOs, journalists and governments to work with data – and has often had to crack-out her own data wrangling skills to tame unruly data beasts. A particular favourite of Lucy’s is “Tech Translation” – i.e. converting ‘geek speak’ to human, something she hopes to get the chance to put into action working with the School of Data team.

Many of you will have come across Lucy already at Open Knowledge Foundation events, on our recent tour of India, or around and about in the open data world. If you haven’t yet met her, you’ve probably got an email from her (see below). But if not, then be sure to say hi – she’s amazing and you won’t regret it :)

Data Wrangling Advice: Note Lucy’s excellent choice of the ‘Pie-Chart Diagram’ for simple percentage data. Great work Lucy. But warning: Lucy may want to check her underlying data for accuracy. Have you really emailed 90% of the world, Lucy? Or just 90% of the people you have ever met, read about or seen on TV…? – ed.

I’m going to be gradually stepping back whilst Lucy takes over, and look forward to joining the ranks of School of Data volunteers in the weeks to come. I know the School will flourish, and can’t wait to watch the first cohort develop!

Flattr this!

Data at the Karnataka Learning Partnership

- October 11, 2012 in Data Stories

Megha Vishwanath outlines how the Karnataka Learning Parntership have been working to collect and analyse data about public schools in India. Below, Megha talks us through the process of collecting data, how they integrated their information with other data sources, the stories they have already found, and the next steps for the project.

An Introduction to the Karnataka Learning Partnership

The Karnataka Learning Partnership (KLP) was formed as a framework for nonprofits, corporations, academic institutions and citizens to get involved in improving government schools in Karnataka, India. KLP aims to be an independent platform for data collation, visualisation, sharing and data-driven advocacy in Public education.

Infrastructure issues in Government schools and preschools have a domino effect on the whole functioning of a school. KLP reports aggregate data and summarise the status of public education. For more about the KLP, see this post on the OKFN India blog.

KLP’s Reports

At KLP, we try to make information on the status of public schools available, in order to allow elected representatives to better allocate budgets and improve local schools. Last academic year, KLP published overviews on:

  • The demographics of government schools and preschools
  • Financial allocations to government schools
  • Infrastructure of government schools

The reports can be found here. The basic information for a Government school / preschool and the MP and MLA linkages per school is available as raw csv download on the website. Any additional information per school or preschool either from KLP’s database or the DISE database can be provided quickly on request.

We thank our Visualisation experts – Anand S and Rahul Gonsalves for consulting with us pro bono to make these reports meaningful.

The Data: What do we have?

Much of the data was gathered over the past decade by the Akshara Foundation. This data, collected and cleaned up, feeds KLP’s public database. For every school we have at a minimum a category, medium of instruction and DISE code (a unique identifier by which the Education Department publishes data). Additionally for all schools in Bangalore we have addresses, geo location and photo identifiers.

Akshara’s field staff mapped an MP constituency, MLA constituency and Ward name for every school and preschool in Bangalore. At first, some of the data was clearly erroneous. The exercise of collecting information was repeated several times until the numbers seemed acceptable, and until we had a mapping for every government school in Bangalore.

What kind of stories could be told with this data?

Some of the questions we were able to ask of data for this report were:

  • How many schools are there in this electoral region? How many students?
  • What’s the gender profile?
  • What categories of schools exist? What is enrollment per category?
  • Which local langauges are spoken, and are there sufficient schools to meet the needs of a multilingual community?

Within the reports, we published comparative graphs. Because the report is meant to be informative, we haven’t indicated e.g. whether 17 Urdu schools would be sufficient for the 938 Urdu speaking children in BTM Layout, Bangalore – but this data would clearly allow others to ask questions and begin drawing conclusions.

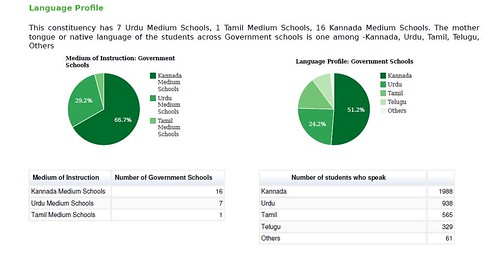
Simple ‘group by’ queries of our school table can yield a pie graph like the one above. On our public KLP database we provide aggregated views of the data. This can be grouped by e.g. MLA Constituency and mother tongue via school IDs.

Linking our data with information about government budgets

In order to report on financial allocations to Government schools, we needed more than our own internal data. Therefore we also began to integrate data from two further sources:

1) PAISA is Accountability Initiative’s flagship project, which works to develop innovative models to track social sector programs. From PAISA, we found that Government schools receive funding according to the following measures:

  • School Maintenance Grant: Rs. 5,000 for up to 3 classrooms & Rs. 10,000 for >3 classrooms.
  • School Grant: Rs. 5,000 for lower primary schools and Rs. 7,000 for upper and model primary schools
  • TLM Grant: Rs. 500 per teacher

2) NUEPA-DISE: District Information System for Education’ (DISE) is a public database providing comprehensive information on Government schools across India. Year on year, the database is updated and information on basic identifiers (teachers, compliance with Right to Education, enrollment, financial allocation, school facilities etc) is published. From the DISE database, we could determine the number of classrooms and the number of teaching staff in a school.

More data, more questions..

With more data, there were many more questions that could be answered. For instance, our data now included a table of facilities. So, we could ask:

  • How many schools in this electoral region have a play ground?
  • How many of them have a library? How many actually have books in the library?
  • How many schools have a separate girls toilet?

We did have to apply some of our own assumptions to the flat DISE data in order to assign a binary (0/1) score for each of the facilities for each school. As an example:

  1. The facilities table has a column – with values <1> indicating a library exists & <2> indicating that it does not exist. Additionally there’s a column with a numeric count. Only if library = 1 and books_in_library > 0 does it mean that the school has a functional library
  2. The table has columns & which contain a numeric count. If toilet_common > 0 it means that the school has a common toilet. If toilet_girls > 0 it means that the school has a separate girls’ toilet.

The 11 parameters were summarised to produce the kind of indication below:

Each of the above indicators is a single or composite representation of the larger set of indicators. The colour coding indicates whether the constituency scores better than the chosen sufficiency condition for a particular indicator or not. The question asked of the aggregated data therefore becomes e.g. do 70% of the schools in this constituency have playgrounds?

Allowing for geographical comparisons

Early on in the design of our reports, we understood that it might be useful to compare constituencies with neighbouring areas. A manual exercise of reviewing which constituencies shared boundaries was carried out on publicly visible (but not downloadable) shape files on bbmpelections.in.

The results of sharing these reports

The feedback of our Elected Representatives to these reports have been overwhelming. From “wanting to make mine a Model Constituency” to “please keep me informed about the problems in my area”, these positive responses keep us motivated to publish information. The write up on the team’s experiences in delivering these reports can be found here.

The Technology Behind it All:

The underlying reporting engine is python – web.py based web app reading from a Postgres database that brings in views from the multiple data sources. Python scripts were written for all data scraping, data base creation and cleanup processes. Charting libraries used are from Google Visualization. The report is an HTML5 web page that is styled with CSS and printed off the browser in high quality.

Unicode compliance, to be able to produce a bilingual report was key to this design. The current code repository is on Github

So what next?

  • We will be reporting particularly on Library Infrastructure and Learning Outcomes in these constituencies.
  • We need in terms of a tech stack a rigourous reporting tool that seamlessly integrates with unicode, print formats / styling and can zoom in and zoom out on the aggregated data based on a selection of geography.
  • We intend to integrate these reports if shapes files and proper geocodes be available for all these constituencies on our map page. We also need a map-math based method to determine geographic neighbours or a ward / constituency.

There’s a lot of work ahead of us though these are seemingly simple wants/needs. We invite programming and visualisation enthusiasts to help us do this task better. We welcome all constructive criticism and inputs from the data communities at dev [@] klp.org.in

Flattr this!

On the Road: African News Innovation Challenge TechCamp in Zanzibar

- October 6, 2012 in Uncategorized

Out data wrangler Michael Bauer is on tour through Tanzania and Ghana. His first stop: The African News Innovation Challenge (ANIC) TechCamp in Zanzibar. Read his impressions below.

How do you innovate the news? You bring a bunch of technology geeks and journalists to low bandwith paradise and let them bounce ideas off each other for three days. Sounds like a good idea? Well yes… it is.

The African News Innovation Challenge is a program to fund innovative ways of improving reporting and journalism in Africa. It was conceived by the African Media Initiative and right now is having it’s first round of funding. Forty projects were nominated as finalists and were invited to a three day barcamp-like event in beautiful Zanzibar.

The event, co-organized by the African News Innovation Challenge and the US State Department, brings together ANIC finalists, technology experts, journalists and civil society organizations to re-think and re-design their submissions. The Open Knowledge Foundation’s Open Spending team – collaborating with the Open Institute – is one of the finalists in this challenge. So I got to serve a dual role: representing a partner in one of the finalist projects and facilitating sessions on Open Data, Freedom of Information and Models for Financial Reporting.

The first day started off with an intense set of sessions – from design thinking exercises in teams to deep sessions on specific technical or journalistic subjects. The challenge of participating in those was to select from a wide range of topics – most of them too interesting to miss. Conversations continued until late at night.

TechCamp will end October 8th. I’ll stay in Tanzania for an Open Data workshop in Dar from 18th-20th October and then move on to Ghana after this. If you’re interested meeting during that time, contact schoolofdata [@] okfn.org

Flattr this!

The School of Data is [no-longer] hiring!

- September 25, 2012 in Uncategorized

Please note: the recruitment process for a Project Coordinator has now closed. If you are interested in working for the Open Knowledge Foundation, please see our jobs page for more details.

[Project Coordinator – Job Description] – Position now closed

The School of Data is a project to teach data wrangling skills to an international audience. We aim to enable and inspire e.g. NGOs, civil society organisations, journalists and citizens to use, analyse and interpret data more effectively.

The School of Data collaboration is led by the Open Knowledge Foundation and P2PU. The new Project Coordinator will be part of the Open Knowledge Foundation team, and will be responsible for liaising between stakeholders and coordinating the overall activities of the School.

The successful candidate will be bright, articulate and confident, with excellent written and verbal communication skills. Strong organisational and administrative skills are essential, as is the ability to build relationships, develop new opportunities, and provide positive leadership for this distributed team.

Prior experience of working with data – particularly for journalism / an NGO – would be a bonus, but more important is dedication and the ability to learn. This role could suit an exceptional young graduate, as well as someone with previous experience.

Areas of Responsibility

Team Coordinator/Lead

  • Liaising with stakeholders – including funding bodies, partners, volunteers and the School of Data team.
  • Reaching out to new audiences, engaging the community and providing support.
  • Acting as a public face for the School of Data, responding to incoming inquiries.
  • Coordinating events, leading workshops, networking.
  • Taking responsibility for budget oversight and planning.

Project Development

  • Spotting opportunities for collaboration.
  • Developing & maintaining relationships with relevant organisations and initiatives.
  • Overseeing (and writing) funding proposals, press releases, MoUs etc.

Project management

  • Managing budget and resources.
  • Internal & external reporting.
  • Leading meetings, coordinating workflows, taking responsibility for progress towards deliverables.

Essential Skills

  • Excellent verbal and written communication skills.
  • Fluency in English, plus the ability to communicate with people for whom English is not their first language, particularly via email and Skype.
  • Organisational and administrative skills, including e.g. time management & event coordination.
  • Some experience of budget & project management.
  • Competency in maths; basic familiarity with statistics and data analysis.
  • The flexibility and pragmatism to turn a vision into a living product.

Other Qualities

  • Willingness to travel.
  • A willingness to occasionally work outside ‘office hours’ – usually in order to attend an event or to coordinate across time zones.
  • Experience of working with a distributed global team.
  • Optimally, experience of working in journalism, research and/or with an NGO.
  • Familiarity with organisations such as the Open Knowledge Foundation, P2PU, Tactical Tech, Creative Commons, MySociety, Wikimedia etc. would be a bonus.
  • ‘Data Wrangling’ skills would be a distinct advantage.

Location: We are flexible about where you are located, and there is the possibility to work remotely from anywhere in the world. If you are close to one of the OKFN’s existing hubs in London, Cambridge (UK) or Berlin, that would be an advantage. The School of Data team are currently also based in Vienna and San Francisco. No-one should feel discouraged from applying based on location – but be aware that office hours may need to be adapted depending on your timezone.

Salary: Negotiable, dependent on experience.

To Apply

Please send a CV and covering letter to [email protected]. Please include a short (1 minute) video explaining why you are interested in this role.

Applications will be assessed on a rolling basis; please apply as early as possible.

Flattr this!

Geo-locating wells in South Sudan: how to wrangle data for development

- August 31, 2012 in Data Stories

Dominik Moritz, a student at the University of Potsdam and an intern with the Open Knowledge Foundation, recently took part in the London ‘Development Data Challenge’. In this post, he walks through the process of how he used data to create this interactive visualisation, which pinpoints settlements in South Sudan and their proximity to the nearest well.

An introduction to the project

Visualizing geocoded data can be very difficult… or very easy, and at the same time beautiful and useful. At the Development Data Challenge in London on the weekend of 25th-26th August 2012, we built an interactive map of wells in South Sudan, to demonstrate how open data can be used to visualize problems and to help to find solutions.

The process we used to build the map can be split up into three separate parts.

1) First, we thought about questions we wanted to answer with our visualization. In this case, our goal was to visualize the distances from a village to the next water source – which could either be a well or a waterway.

2) In a second step, we searched for the data which could be used to create the visualization. We used data from the UNDP South Sudan IMWG data team. This data is not yet fully open, and there is still some work to be done to track all the contributing sources and to resolve some licensing issues. However, once the data is ready it will be published on the Datahub. In order to create a dataset that contains the distances to the next water source, we used two datasets; one dataset with settlements and one dataset with the locations of waterways and wells.

3) Once we had our data, all that remained was the build the map!

Using Leaflet to build a map

Once we had the data in a GeoJSON format, we needed to build a map view to show where settlements and wells are located. We used the Leaflet mapping library which provides an easy to use interface as well as a number of great plugins to work with. Leaflet itself is open source and so are the maps that are made from the data by the open street map project.

Creating an interactive map with leaflet is very easy.

  • We created an html page that contains the hook, the position where the map will be inserted and added the leaflet library as explained in the documentation.
  • We wanted our map to be full screen; so we added a few lines of CSS to scale the map to the full size.
  • We then added the different layers, in order to pinpoint on the map those settlements which do not have a water source within a certain radius.

Refining the Visualisation – Colour & Clustering

To support the visualisation, we coloured the circles that show where the settlements are located. Initially, we also wanted to add a layer which would show all the settlements. However, we soon realized that there were far too many for this to be feasible. Luckily there is a plugin on Leaflet to cluster markers. Clustering means that a number of markers which are close to each other get combined into one. The plugin can easily handle up to 50,000 markers, which makes it a great tool for large datasets.

Clustering comes with its own problems however, and we soon realized that clustering makes it very difficult to see whether settlements are concentrated in a certain area – potentially useful information. This is why we added a heat map that shows where most settlements are concentrated. However, we noticed that the visualization is relatively slow and we hope that the plugin will improve in the future.

Future Possibilities… and a Cautionary Word

On the first day, we only added points to the map. However, it is also possible to add lines (in our case rivers) and even image overlays. We added a hydrogeographic map that shows the specific roles of climate and water in the landscape.

There are many more potential applications for the map. For example, we also spent some time trying to connect the wells data with spending data released through IATI and NGO websites, so that money could start to be connected to results and needs on the ground (and vice versa). There is much more work to be done on this, and members of the Standby Task Force team are hopeful that some of their data-gathering work connected to pre-crisis indicators will be useful for this in the future – as the South Sudan data proved to be.

It is also worth noting that the team didn’t ‘just’ spend the weekend cutting code however. Various work had to be done to ensure the integrity of the data, and the team spent a lot of time trying to track all the sources who had contributed to the dataset. There are also some ongoing licensing issues which need to be resolved before the datasets can be officially released.

As a team, we were really surprised by the results of our weekend’s work. Hopefully, this map should be a great starting point for anyone who is involved with a water project in South Sudan – and the process could be replicated in other areas. We hope to encourage more organisations and governments to publish their data so that people can work with the data and build visualizations.

You can see the map that Dominik’s team built, as well as the Github repository. Read more about other projects from the Development Data Challenge on the OKFN main blog.

Flattr this!

Test cohort: sign-up is now closed

- August 31, 2012 in Uncategorized

Many thanks to everyone who has volunteered to sign-up for the test cohort at the School of Data.

We have had an overwhelming response, with people signing up from all over the globe. It’s been really wonderful to see the enthusiasm!

From the list of people who have signed-up, we will select a small group to act as ‘testers’ for this course. We are trying to get a balance of people from different locations and with different skills, and we will be in touch shortly to let you know whether you have been selected.

If you haven’t been selected on this occasion – don’t panic! There will be plenty more opportunities to test other courses in future, and everyone will be able to take the course once it is launched.

We are really grateful to everyone who has signed up for the School of Data and offered feedback. Thank you so much for your time, and do keep an eye on the School as it continues to develop!

Flattr this!

Join the School of Data test cohort!

- August 29, 2012 in Uncategorized

We are seeking volunteers to take part in an ‘alpha cohort’, to test-run initial courses for the School of Data. Sign up below!

The Course

The very first School of Data course, ‘What is Data?’, will offer a basic introduction to Data Wrangling skills. Participants will explore how to find data, develop basic spreadsheet skills, and get to grips with how to interpret and create simple charts and diagrams.

The course will be structured around six individual learning modules:

1) Getting Started: Finding the Data
2) Sort and Filter: The basics of spreadsheets
3) ‘But what does it mean?’: Analysing data (& spreadsheets continued)
4) From Data to Diagrams: An introduction to plots and charts
5) Look Out!: Common misconceptions (and how to avoid them)
6) Tell me a story: Working out what’s interesting in your data

The Test Cohort

The test course will run for three weeks, from 3rd – 25th September. Each individual module should take no more than an hour or two to complete, and can be taken at any time before the relevant Hangout.

Twice a week, we will hold a short Google Hangout to discuss the experience of working through the learning modules. During these sessions, you will have the opportunity to share what you learned and to offer feedback on the course.

The Google Hangouts will take place at 6pm UTC (= 7pm in the UK, 8pm in Central Europe, 2pm EDT, 11am PDT) on Tuesdays and Thursdays. If you would like to join the test cohort but can’t make the time slots we have suggested, please do get in touch!

Provisional timetable of Hangout sessions

  • Thursday 6th September, 6pm UTC – Getting Started
  • Tuesday 11th September, 6pm UTC – Sort and Filter
  • Thursday 13th September, 6pm UTC – ‘But what does it mean?’ Analysing Data.
  • Tuesday 18th September, 6pm UTC – From Data to Diagrams
  • Thursday 20th September, 6pm UTC – Look Out! Avoiding common misconceptions
  • Tuesday 25th September, 6pm UTC – Tell me a Story

Please Note: If you would like to join the alpha test cohort, we ask that you would commit to attend at least 5 of the 6 hangouts, and to offer feedback on a regular basis.

The ‘What is Data’ course is targeted towards beginners. However, we hope that the alpha cohort will include a mix of novices and experienced data wranglers, to allow us to gather feedback from a variety of perspectives.

Can you offer robust and critical feedback? Do you want to develop new data skills? Revive rusty ones? Help to improve the courses which will give many others an introduction to data? Fill in the form below!

PLEASE NOTE: Sign-up for the alpha test cohort is now closed

For more details, please contact schoolofdata [@] okfn.org

Flattr this!

School of Data: Live in India

- August 23, 2012 in Events

Lucy Chambers and I recently travelled to India, to meet people working with open data and to explore the challenges they face. For more details of some of the discussions that took place on our journey, see the series on the main blog.

In the IT city of Bangalore, Lucy and I attended the Fifth Elephant – a big conference on big data. For two full days, around 700 participants flooded the Nimhans Convention Centre, keen to explore the latest opportunities in data technologies and techniques.

The conference was preceded by a day of workshops, during which both Lucy and I led sessions on OpenSpending and the School of Data. There had been a considerable waiting list for places on the session – which had been billed as basic – but given the conference’s largely technical audience, we were unsure what skill levels to expect. To my relief on the day, everyone turned up with a laptop and there was a decent internet connection. From a quick hands-up, the group was made up largely of programmers, software developers and data analysts. More or less everyone said they were comfortable with the basics of data cleaning, spreadsheets and simple graphs. So far so good.

The Wrangling Challenge

Thanks to the wonderful @datatelling, the workshop was themed around an interesting set of data on CO2 emissions. Recently, the Guardian ran a story on the countries which emitted the most carbon dioxide.

The Guardian’s visualisation is pretty interesting. India appears to be one of the biggest carbon culprits – the third biggest emitter of CO2 in the world. Yet per capita emissions tell a different story (as the Guardian acknowledged). India produces only 1.38 tonnes per person per year, compared to 18 in the USA and a global average of 4.49 tonnes per person per year. The room smiled – not so guilty then.

After a bit of discussion about how data can be (mis)represented, we got down to some wrangling. The room was provided with three data sets – CO2 emissions, population, and GDP – all with data which covered the last five years or more. Using this data (and with free rein to search for more if they felt confident to do so!), groups were asked to pose themselves a question to investigate. GDP seemed to spark the most interest, with several groups choosing ambitious projects to explore ‘carbon efficiency’ (as measured by GDP per capita / CO2 per capita). Others chose to explore carbon emissions in different continents, to look at which countries’ emissions had changed most over time, or to explore whether countries which had experienced a sharp rise in GDP had also experienced a sharp rise in CO2 emissions.

After deciding what to investigate, we all walked through the principles of cleaning, merging, analysing and representing data – with everyone carrying out the steps in order to answer the question that they had posed.

Too much information!

Circulating around the room, the areas that caused problems to the trainee data wranglers were often surprising to us.

Spreadsheets

Some technical glitches were always to be expected as people struggled to navigate different versions of Excel / OpenOffice / GDocs. But given that the majority of the audience was highly technical, the general lack of familiarity with spreadsheets was a surprise. One participant told me that he would find it easier to write some code to perform basic data analysis than to use a simple spreadsheet. This was definitely a learning point for us, and throughout our travels, many people reiterated that there was a clear need for better training in basic spreadsheet skills.

Selectivity

Too much information!…

Another common problem we encountered was actually paring down the information. Selecting which data to plot on which axes, deciding on the most appropriate form of graph to use, and working out how many variables could realistically be presented often proved challenging – a lot of ambitious and intelligent people want to use ALL the data in one go! It soon became apparent that one of the less recognised skills for Data Wranglers is actually deciding which aspects of the data to ignore in order to pull a coherent story or visualisation together. We hope that this is something that the School of Data can help people to become more comfortable with in future.

Understanding visualisations

Linked to this, the more we travelled in India, the more it was reported to us that many (or even most) people find it difficult to interpret visually-represented data – even when this is displayed in relatively simple bar charts and line graphs. Learning how to decode visually represented information is a skill that needs to be developed like any other. With these fresh insights into the challenges that people face, hopefully the School of Data can work to address basic data literacy skills, and improve people’s ability to both present and interpret visual data.

The Challenges

As expected at its first live trial, there was a lot to learn from the School of Data workshop. In an hour and a half, we got through the bulk of the exercise, but could definitely have used an extra fifteen minutes to wrap up and reflect on what we’d learned. There were a few too many ‘technical’ hold-ups (‘where is the sort function on my spreadsheet?’) and not quite enough space to reflect on some of the more interesting challenges that people encountered. Because people came with different skills and backgrounds, some were lost at points of the exercise whilst others were sailing. Many of these problems face all learning endeavours. When the School of Data launches online, some will be resolved (a key strength of the P2PU learning challenges model is the fact that it allows you to work at your own pace) – but new ones will undoubtedly appear (managing really slow internet connections, anyone?).

The Successes!

But despite some imperfections, the workshop was undoubtedly a success. On behalf of the School of Data, I learned a lot about which problems actually challenge data wranglers. I have a much better understanding of the level that many people are beginning from. And I recognise some of the practical and technical barriers that we’re going to have to work through. Personally, I can’t wait to put all that I found out into action!

But of course, the biggest successes of the workshop weren’t about us. As we continued to move around the data circles in Bangalore, Lucy and I met several of our workshop ‘students’ again. Two young men carried on working with the data sets we had provided after the session, ultimately managing to produce a graph of the ‘carbon efficiency’ of certain countries – which had some intriguing results. Their pride and sense of achievement was wonderful to see! Another participant had gone on to gather his own data on anonymous sources, and was keen to get my help in wrangling his way through it. Everyone had a cheery wave and a positive word, and many also offered helpful feedback.

Generally, we saw huge enthusiasm for Data Wrangling in India. One person told me that he had never known he had the ability to wrangle data, but that he loved it and hoped to carry on! The more we travelled, the more support we saw for the School of Data initiative. It will be great to see the Data Wrangling community blossoming around School of Data courses over the coming months.

The Next Steps

Look out for more activity coming soon on the School of Data mailing list and blog as our development phase really kicks in.

If you want to get involved, you can:
* Sign up for the quiet School of Data mailing list or get involved with the building on the higher traffic development list.
* If you are based in India, join the open data community here.
* Otherwise, check out our FAQs for more ideas about how to get involved.

Questions? Email schoolofdata [@] okfn.org

Flattr this!

Welcome to the School of Data blog!

- June 19, 2012 in Uncategorized

Welcome to the School of Data’s new blog.

This is a space for learners, data wranglers, and anyone with an interest in data to share news, stories, and tips and tricks for working with data.

If you would like to post something on the School of Data blog, please email schoolofdata [@] okfn.org.

Flattr this!