Opening up Data on Fires in Portugal
Olaf Veerman - November 27, 2013 in Data for CSOs
Large areas of forest and agricultural land burn down each year in Portugal, especially during the hot summer months. The Portuguese media cover these fires with great intensity, and it’s sometimes hard to get the full picture from the individual reports that mostly focus on the very big fires.
This summer we launched incendios.pt, a project that visualizes all fire-related occurrences in Portugal between 2001 and 2012. Based on a dataset with over 400,000 occurrences, the application allows users to explore the data by location and topic.
Explore by location
Since every occurrence in the dataset is geo-referenced, maps play an important role on the site. These maps, powered by Tilemill, Mapbox and Leaflet, show some striking regional differences, both in terms of frequency of fires and in size of the area burnt.
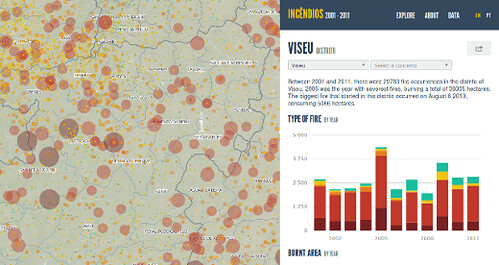
While incendios.pt tries to provide the big picture of fires in Portugal, a lot of people will be interested in seeing statistics on particular areas of their choice, for example their hometown. That’s why every administrative area (district, municipality and parish) has its own page showing the number of fire occurrences, the type of fire and the size of the burnt area. We made an effort to make exploration of these pages as easy as possible. People can use the hierarchical selector, drilling down one administrative area at a time, or click on the location of their choice on the maps.
An advantage of having a single page per administrative area is that they are easy to share. Every page has a human-readable URL that contains an indication of the parent areas. The full URL for a parish contains an indication of its district and municipality, for example: http://incendios.pt/en/por/braga/braga/priscos.
The application also makes an effort to resolve incomplete URLs. If somebody types in http://incendios.pt/en/por/priscos (without the district and municipality), the application will, instead of showing a ‘Page not found’, make a reasonable effort to find the appropriate area.
Explore by topic
The original dataset is very detailed and contains a lot of information about each occurrence, including start and end dates, causes and type of area burnt. Since it doesn’t always make sense to show the data aggregated by administrative area, we’ve added story pages that contain analysis on specific topics.
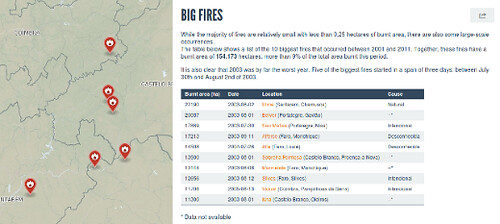
These pages give us more freedom to emphasize certain aspects of the dataset, but they also allow us to integrate custom visualizations that are not necessarily location-related.
The data
The original dataset was published by ICNF, a Portuguese government agency tasked with the conservation of nature and forests. Although the data is surprisingly consistent and well curated, ICNF made it available as a series of zipped Excel files, with data for each year stored in a different worksheet. This is hardly a format that allows people to get a quick overview of the situation.
For the purpose of this project we processed the data using tools like CSVKit and OGR and stored it as JSON documents in MongoDB. During this process, we tried to script as much of this processing as possible. Not only to facilitate any changes during the development of the application, but also to be able to incorporate new data in the future as easy as possible.
Next steps
Incendios.pt is fully built on open source technology, mainly on Express, MongoDB, Mapbox, Leaflet, Chosen and Morris. We’re looking into the possibilities of releasing the basic application as an open source product itself, since it provides pretty solid features such as a responsive layout and multilingual capabilities. With relative ease, it could be used to visualize data on any other theme, always with the administrative area as main unit of analysis.
In the near future, we will add more content to incendios.pt and new features, most importantly to present the data of the individual occurrences. This should make it even easier for people to explore the dataset and contribute back with interesting analysis. If you want to talk to us about any of this, or have interesting ideas, feel free to drop us a line.
![]()