Using SQL for Lightweight Data Analysis
This article introduces the use of SQL for lightweight data analysis by walking through a small data investigation to answer the question: who were the top recipients of Greater London Authority spending in January 2013?
Along the way, it not only introduces SQL (and SQLite) but illustrates various other skills such as locating and cleaning data and how to load tabular data into a relational database.
Note: if you are intrigued by the question or the data wrangling do check out the OpenSpending project – the work described here was part of some recent work by OpenSpending community members at a recent Open Data Maker Night.
Finding the Data
First we need to locate the data online. Let’s start with a web search, e.g.: “London GLA spending” (GLA = greater london authority). This quickly yields the jackpot in the form of this web page:

For our work, we’ll focus on the latest month. So jump in and grab the CSV file for February which is at the top of that page (at the moment!).
Preparing the Data
The data looks like this (using the Chrome CSV Viewer extension):
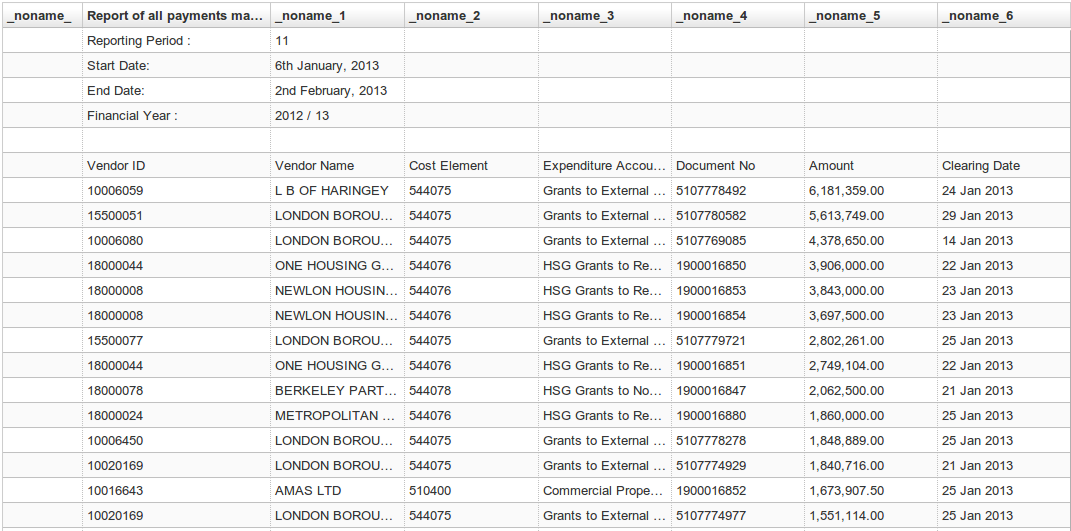
Unfortunately, it’s clear these files have a fair amount of “human-readable” cruft that make them unsuitable for further processing without some cleaning and preparation. Specifically:
- There is various “meta” information plus a blank linke at the top of each file
- There are several blank lines at the bottom
- The leading column is empty
We’ll need to remove these if we want to work with this data properly – e.g. load into OpenSpending, put in a database etc. You could do this by hand in your favourite spreadsheet package but we’ll do this using the classic UNIX command line tools head, tail and sed:
tail -n +7 2012-13-P11-250.csv | head -n -4 | sed "s/^,//g" > 2013-jan.csv
This command takes all lines after the first 6 and before the last 4, strips off the leading “,” and puts it in a new file called 2013-jan.csv. It uses unix pipes to run together these few different operations:
# strip off the first 6 lines
tail -n +7

# strip off the last 4 lines
head -n -4

# remove the lead column in the form of "," at the start of each line
# "^," is a regular expression matching "," at the start of a line ("^"
# matches the start of a line)
sed "s/^,//g"
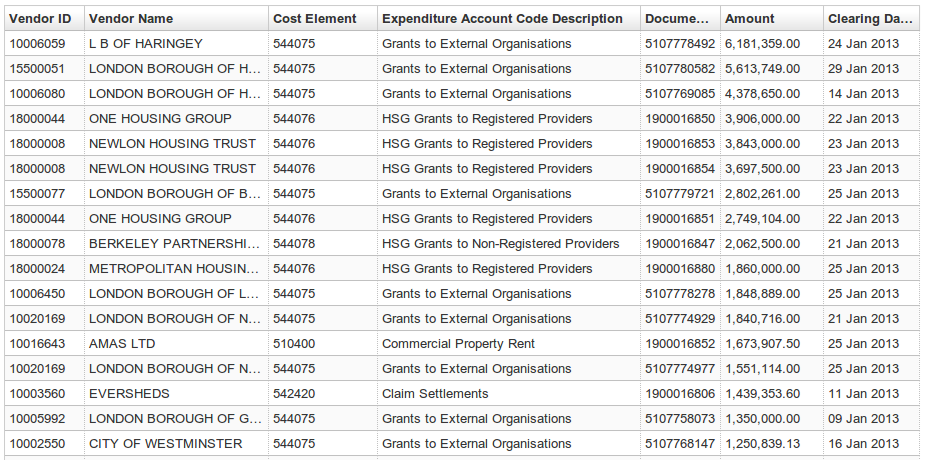
The result of this is shown in the screenshot below and we’re now ready to move on to the next stage.
Analyzing the Data in a Relational Database (SQLite)
Our aim is to work out the top recipients of money. To do this we need sum up the amounts spent by Vendor (Name). For the small amount of data here you could use a spreadsheet and pivot tables. However, I’m going to take a somewhat different approach and use a proper (relational) database.
We’ll be using SQLite, an open-source relational database that is lightweight but fully-featured. So, first check you have this installed (type sqlite or sqlite3 on the command line – if you don’t have it is easy to download and install).
Loading into SQLite
Now we need to load our CSV into SQLite. Here we can take advantage of a short python csv2sqlite script. As its name suggests, this takes a CSV file and loads it into an SQLite DB (with a little bit of extra intelligence to try and guess types). The full listing for this is in the appendix below and you can also download it from a gist here. Once you have it downloaded we can use it:
# this will load our csv file into a new table named "data"
# in a new sqlite database in a file named gla.sqlite
csv2sqlite.py 2013-jan.csv gla.sqlite
Analysis I
Let’s get into the SQLite shell so we can run some SQL:
# note you may need to run sqlite3 rather than sqlite!
sqlite gla.sqlite
Now you will be in the SQLite terminal. Let’s run our query:
sqlite> SELECT "Vendor Name", sum(amount) FROM data
          GROUP BY "Vendor Name"
          ORDER BY SUM(amount) DESC
          LIMIT 20;
How does this work? Well the key thing here is the “GROUP BY” which has a similar function to pivoting in spreadsheets: what it does is group together all the rows with the same value in the “Vendor Name” field. We can then use SELECT to specify fields, or functions of fields that are common or aggregate across all the rows with the same “Vendor Name” value. In this case, we just select the “Vendor Name” and the SUM of the “Amount” field. Lastly, we order the results by the sum (descending – so most first) and limit to only 20 results. The result is as follows:
Vendor Name                          SUM(Amount)
-----------------------------------  -----------
NEWLON HOUSING TRUST                 7540500.0
ONE HOUSING GROUP                    6655104.0
L B OF HARINGEY                      6181359.0
LONDON BOROUGH OF HACKNEY - BSP      5665249.0
LONDON BOROUGH OF HAVERING           4378650.0
LONDON BOROUGH OF NEWHAM             3391830.0
LONDON BOROUGH OF BARKING            2802261.0
EVERSHEDS                            2313698.54
METROPOLITAN HOUSING TRUST LIMITED   2296243.0
BERKELEY PARTNERSHIP HOMES LIMITED   2062500.0
LONDON BOROUGH OF LAMBETH            1917073.95
PARADIGM HOUSING GROUP LIMITED       1792068.0
AMAS LTD                             1673907.5
VIRIDIAN HOUSING                     1467683.0
LONDON BOROUGH OF GREENWICH          1350000.0
CITY OF WESTMINSTER                  1250839.13
CATALYST HOUSING GROUP LTD            829922.0
ESTUARY HOUSING ASSOCIATION LIMITED   485157.0
LOOK AHEAD HOUSING AND CARE           353064.0
TRANSPORT FOR LONDON                  323954.1
We could try out some other functions, for example to see the total number of transactions and the average amount we’d do:
sqlite> SELECT "Vendor Name", SUM(Amount), AVG(Amount), COUNT(*)
          FROM data
          GROUP BY "Vendor Name"
          ORDER BY sum(amount) DESC;

Vendor Name                          SUM(Amount)  AVG(Amount)  COUNT(*)
-----------------------------------  -----------  -----------  ----------
NEWLON HOUSING TRUST                 7540500.0    3770250.0    2
ONE HOUSING GROUP                    6655104.0    3327552.0    2
L B OF HARINGEY                      6181359.0    6181359.0    1
LONDON BOROUGH OF HACKNEY - BSP      5665249.0    1888416.333  3
LONDON BOROUGH OF HAVERING           4378650.0    4378650.0    1
This gives us a sense of whether there are many small items or a few big items making up the expenditure.
What we’ve seen so far shows us that (unsurprisingly) GLA’s biggest expenditure is support to other boroughs and to housing associations. One interesting point is the approx £2.3m paid to Eversheds (a City law firm) in January and the £1.7m to Amas Ltd.
Analysis II: Filtering
To get a bit more insight let’s try a crude method to remove boroughs from our list:
sqlite> SELECT "Vendor Name", SUM(Amount) FROM data
          WHERE "Vendor Name" NOT LIKE "%BOROUGH%"
          GROUP BY "Vendor Name"
          ORDER BY sum(amount)
          DESC LIMIT 10;
Here we are using the WHERE clause to filter the results. In this case we are using a “NOT LIKE” clause to exclude all rows where the Vendor Name does not contain “Borough”. This isn’t quite enough, let’s also try to exclude housing associations / groups:
SELECT "Vendor Name", SUM(Amount) FROM data
  WHERE ("Vendor Name" NOT LIKE "%BOROUGH%" AND "Vendor Name" NOT LIKE "%HOUSING%")
  GROUP BY "Vendor Name"
  ORDER BY sum(amount)
  DESC LIMIT 20;
This yields the following results:
Vendor Name                          SUM(Amount)
-----------------------------------  -----------
L B OF HARINGEY                      6181359.0
EVERSHEDS                            2313698.54
BERKELEY PARTNERSHIP HOMES LIMITED   2062500.0
AMAS LTD                             1673907.5
CITY OF WESTMINSTER                  1250839.13
TRANSPORT FOR LONDON                  323954.1
VOLKER FITZPATRICK LTD                294769.74
PEABODY TRUST                         281460.0
GEORGE WIMPEY MAJOR PROJECTS          267588.0
ST MUNGOS                             244667.0
ROOFF LIMITED                         243598.0
R B KINGSTON UPON THAMES              200000.0
FOOTBALL FOUNDATION                   195507.0
NORLAND MANAGED SERVICES LIMITED      172420.75
TURNER & TOWNSEND PROJECT MAGAG       136024.92
BARRATT DEVELOPMENTS PLC              108800.0
INNOVISION EVENTS LTD                 108377.94
OSBORNE ENERGY LTD                    107248.5
WASTE & RESOURCES ACTION PROGRAMME     88751.45
CB RICHARD ELLIS LTD                   87711.45
We still have a few boroughs due to abbreviated spelling (Haringey, Richmond, Westminster) but the filter is working quite well. New names are now appearing and we could start to look intro these in more detail.
Some Stats
To illustrate a few additional features of let’s get some overall stats.
The number of distinct suppliers: 283
SELECT COUNT(DISTINCT "Vendor Name") FROM data;
Total amount spent in January: approx £60m (60,448,491)
SELECT SUM(Amount) FROM data;
Wrapping Up
We now have an answer to our original question:
- The biggest recipient of GLA funds in January was Newlon Housing Trust with £7.5m
- Excluding other governmental or quasi-governmental entities the biggest recipient was Eversheds, a law firm with £2.4m
This tutorial has shown we can get these answers quickly and easily using a simple relational database. Of course, there’s much more we could do and we’ll be covering some of these in subsequent tutorials, for example:
- Multiple tables of data and relations between them (foreign keys and more)
- Visualization of of our results
- Using tools like OpenSpending to do both of these!
Appendix
Colophon
- More on CSV – Comma Separated Variables
- There is a Chrome extension for viewing CSVs in browser – saves having to download and open all the time!
- You can try out SQL directly online using SQLFiddle
- For the real geeks there is now a version of SQLite in pure javascript
- Several excellent other tutorials on SQL and SQLite including:
CSV to SQLite script
Note: this script is intentionally limited by requirement to have zero dependencies and its primary purpose is to act as a demonstrator. If you want real CSV to SQL power check out csvsql in the excellent CSVKit or MessyTables.
SQL
All the SQL used in this article has been gathered together in one script:
.mode column
.header ON
.width 35
-- first sum
SELECT "Vendor Name", SUM(Amount) FROM data GROUP BY "Vendor Name" ORDER BY sum(amount) DESC LIMIT 20;
-- sum with avg etc
SELECT "Vendor Name", SUM(Amount), AVG(Amount), COUNT(*) FROM data GROUP BY "Vendor Name" ORDER BY sum(amount) DESC LIMIT 5;
-- exclude boroughs
SELECT "Vendor Name", SUM(Amount) FROM data
  WHERE "Vendor Name" NOT LIKE "%Borough%"
  GROUP BY "Vendor Name"
  ORDER BY sum(amount) DESC
  LIMIT 10;
-- exclude boroughs plus housing
SELECT "Vendor Name", SUM(Amount) FROM data
  WHERE ("Vendor Name" NOT LIKE "%BOROUGH%" AND "Vendor Name" NOT LIKE "%HOUSING%")
  GROUP BY "Vendor Name"
  ORDER BY sum(amount) DESC
  LIMIT 20;
-- totals
SELECT COUNT(DISTINCT "Vendor Name") FROM data;
SELECT SUM(Amount) FROM data;
Assuming you had this in a file called ‘gla-analysis.sql’ you could run it against the database by doing:
sqlite gla.sqlite < gla-analysis.sql
![]()