You are browsing the archive for Data Blog.

Data is a Team Sport

- December 20, 2017 in Announcement, Data Blog, Research

Data is a Team Sport is a series of online conversations held with data literacy practitioners in mid-2017 that explores the ever evolving data literacy eco-system. Our aim in producing ‘Data is a Team Sport’ was to surface learnings and present them in formats that would be accessible to data literacy practitioners.

Thanks to the efforts of governments, organizations and agencies to make their information more transparent the amount of data entering the public domain has increased dramatically in recent years. As political and economic forces become more adept at using data, we enter a new era of data literacy were just being able to understand information is not enough. In this project, we aimed to engage data literacy practitioners to capture lessons learned and examine how their methodologies are shifting and adapting. We also wanted to better understand how they perceived the data literacy ecosystem: the diverse set of actors needed to enable and support the use of data in social change work.

Conversation Guests PodCast
Enabling Learning Rahul Bhargava & Lucy Chambers [soundcloud url=”https://api.soundcloud.com/tracks/326264327″ params=”color=#ff5500&inverse=false&auto_play=false&show_user=false” width=”100%” height=”20″ iframe=”true” /]
Data Driven Journalism Eva Constantaras & Natalia Mazotte [soundcloud url=”https://api.soundcloud.com/tracks/328987340″ params=”color=#ff5500&inverse=false&auto_play=false&show_user=false” width=”100%” height=”20″ iframe=”true” /]
One on One with Daniela Lepiz Daniela Lepiz [soundcloud url=”https://api.soundcloud.com/tracks/331054739″ params=”color=#ff5500&inverse=false&auto_play=false&show_user=false” width=”100%” height=”20″ iframe=”true” /]
Advocacy Organisations Milena Marin & Sam Leon [soundcloud url=”https://api.soundcloud.com/tracks/332772865″ params=”color=#ff5500&inverse=false&auto_play=false&show_user=false” width=”100%” height=”20″ iframe=”true” /]
One on One with Heather Leson Heather Leson [soundcloud url=”https://api.soundcloud.com/tracks/333725312″ params=”color=#ff5500&inverse=false&auto_play=false&show_user=false” width=”100%” height=”20″ iframe=”true” /]
One on One with Friedhelm Weinberg Friedhelm Weinberg [soundcloud url=”https://api.soundcloud.com/tracks/335294348″ params=”color=#ff5500&inverse=false&auto_play=false&show_user=false” width=”100%” height=”20″ iframe=”true” /]
Mentors, Mediators and Mad Skills Emma Prest & Tin Geber [soundcloud url=”https://api.soundcloud.com/tracks/336474972″ params=”color=#ff5500&inverse=false&auto_play=false&show_user=false” width=”100%” height=”20″ iframe=”true” /]
Government Priorities and Incentives Ania Calderon & Tamara Puhovski [soundcloud url=”https://api.soundcloud.com/tracks/337462183″ params=”color=#ff5500&inverse=false&auto_play=false&show_user=false” width=”100%” height=”20″ iframe=”true” /]

Read the rest of this entry →

Flattr this!

Data is a Team Sport: Government Priorities and Incentives

- August 13, 2017 in Data Blog, Event report

Data is a Team Sport is a series of online conversations held with data literacy practitioners in mid-2017 that explores the ever evolving data literacy eco-system.

To subscribe to the podcast series, cut and paste the following link into your podcast manager : http://feeds.soundcloud.com/users/soundcloud:users:311573348/sounds.rss or find us in the iTunes Store and Stitcher.

[soundcloud url=”https://api.soundcloud.com/tracks/337462183″ params=”color=ff5500&auto_play=false&hide_related=false&show_comments=true&show_user=true&show_reposts=false” width=”100%” height=”166″ iframe=”true” /]

The conversation in this episode focuses on the challenges of getting governments to prioritise data literacy both externally and internally, and incentives to produce open-data and features:

  • Ania Calderon, Executive Director at the Open Data Charter, a collaboration between governments and organisations working to open up data based on a shared set of principles. For the past three years, she led the National Open Data Policy in Mexico, delivering a key presidential mandate. She established capacity building programs across more than 200 public institutions.
  • Tamara Puhovskia sociologist, innovator, public policy junky and an open government consultant. She describes herself as a time traveler journeying back to 19th and 20th century public policy centers and trying to bring them back to the future.

Notes from the conversation:

The conversation focused on challenges they face pressuring governments to open up their data and make it available for public use.  In order for governments to develop and maintain open data programmes, there needs to be an ecosystem of data literate actors that includes knowledgeable civil servants and incentivised elected officials being held to account by a critical thinking citizenry supported by smart open data advocates. Governments incentivisation for open data can’t be solely based on budgetary or monetary savings, they need to be motivated to want to use data to improve the effectiveness of their programs.

Once elected officials are elected, it’s too late to educate and motivate them enough to push for open data programmes as they have too many other priorities and pressures. They have to have a level of data literacy that will provide enough knowledge, motivation and commitment to open data before they are  elected.

Making arguments for open data is not having adequate impact, but we need to be able to provide good solid stories and examples of its benefits. Those advocating for open data have perhaps been too optimistic that citizens would find the data useful once it has been released. A ‘supply and demand’ frame is still an important way to look at open data projects and assess their ability to have impact.

Access to government produced open data is critical for healthy functioning democracies, but government’s ability to release open data is heavily dependent on their own capacities to produce and work with data.  There is currently not enough technical support for public officials tasked with implementing open data projects.

Resources mentioned in the conversation:

Also, not mentioned, but be sure to check out Tamara’s work on Open Youth

View the full online conversation:

[youtube https://www.youtube.com/watch?v=kK8Pz4DZ06s]

Flattr this!

Data is a Team Sport: Mentors Mediators and Mad Skills

- August 7, 2017 in Community, Data Blog, Event report

Data is a Team Sport is a series of online conversations held with data literacy practitioners in mid-2017 that explores the ever evolving data literacy eco-system.

To subscribe to the podcast series, cut and paste the following link into your podcast manager : http://feeds.soundcloud.com/users/soundcloud:users:311573348/sounds.rss or find us in the iTunes Store and Stitcher.

[soundcloud url=”https://api.soundcloud.com/tracks/336474972″ params=”color=ff5500&auto_play=false&hide_related=false&show_comments=true&show_user=true&show_reposts=false” width=”100%” height=”166″ iframe=”true” /]

This episode features:

  • Emma Prest oversees the running of DataKind UK, leading the community of volunteers and building understanding about what data science can do in the charitable sector. Emma sits on the Editorial Advisory Committee at the Bureau of Investigative Journalism. She was previously a programme coordinator at Tactical Tech, providing hands-on help for activists using data in campaigns. 
  • Tin Geber has been working on the intersection of technology, art and activism for most of the last decade. In his previous role as Design and Tech Lead for The Engine Room, he developed role-playing games for human rights activists; collaborated on augmented reality transmedia projects; and helped NGOs around the world to develop creative ways to combine technology and human rights.

Notes from the conversation

In this episode we discussed ways to move organisations beyond data literacy and to the point of data maturity, where organisations are able to manage data-driven projects on their own. Training in itself can be helpful with hard skills, such as how to do analysis, but in terms of learning how to run a data projects, Emma asserts that you have to run a project with them as it takes a lot of hand-holding. There needs to be commitment within the entire organisation to implement a data project, as it will take support and inputs from all parts.  The goal of DataKind UK’s long-term engagements is to help an organisation to build an understanding of what is good data practice.  

Tin points out how critical it is for organisations to be able to learn from others that are working in similar contexts and environments. While there are international networks and resources that are accessible, his biggest challenge is identifying local networks that his clients can connect with and receive peer support.

Another critical element for reaching data maturity, is the existence of champions striving to develop good data practice within an organisation. Tin and Emma both acknowledge that these types of individuals are rare, have a unique skill set, and are often not in senior management positions. There’s a need for greater support for these individuals in the form of: mentoring, networks of practice and training courses that focus on how other organisations have successfully run data projects.

Intermediaries are often focused on demystifying new technologies for civil society organisations. Currently a lot of emphasis on grappling with the implications of machine learning, but it tends to point out the negative impacts (i.e. Cathy O’Neil’s book on ‘Weapons of Math Destruction’), and there needs to be greater examination of positive impacts and stories of CSO’s using it well and contributing to social good.

DataKind UK’s resources:

Tin’s resources:

Resources that are inspiring Emma’s Work:

Resources that are inspiring Tin’s work:

  • DataBasic.io – A a suite of easy-to-use web tools for beginners that introduce concepts of working with data
  • Media Manipulation and Disinformation Online – Report from Data and Society on how false or misleading information is having real and negative effects on the public consumption of news.
  • Raw Graphs – The missing link between spreadsheets and data visualization

View the full online conversation:

[youtube https://www.youtube.com/watch?v=GmsPcLw4Mec&w=560&h=315]

Flattr this!

Data is a Team Sport: One on One with Friedhelm Weinberg

- July 29, 2017 in Data Blog, Event report

Data is a Team Sport is a series of online conversations held with data literacy practitioners in mid-2017 that explores the ever evolving data literacy eco-system.

To subscribe to the podcast series, cut and paste the following link into your podcast manager : http://feeds.soundcloud.com/users/soundcloud:users:311573348/sounds.rss or find us in the iTunes Store and Stitcher.

[soundcloud url=”https://api.soundcloud.com/tracks/335294348″ params=”color=ff5500&auto_play=false&hide_related=false&show_comments=true&show_user=true&show_reposts=false” width=”100%” height=”166″ iframe=”true” /]

Friedhelm Weinberg is the Executive Director of Human Rights Information and Documentation Systems (HURIDOCS), an NGO that supports organisations and individuals to gather, analyse and harness information to promote and protect human rights. 

Notes from the Conversation

We discussed at what it takes to be both a tool developer and a capacity builder. While the two disciplines inform and build upon each other, Friedhelm strongly feels that the capacity building work needs to come first and be a foundation for tool development. The starting point for human rights defenders is to have a clear understanding of what they want to do with data before they start collecting it.

Where in the past they used external developers to create tools, they have recently hired developers to be on staff and work side by side with their capacity builders. They have also recently been building their own capacity to help human right defenders utilise machine learning for processing large amounts of documents and extracting information about human rights abuses.

Specific projects within Huridocs he talked about:

  • Uwazi is an open-source solution for building and sharing document collections
  • The Collaboratory is their knowledge sharing network for practitioners focusing on information management and human rights documentation.

Readings/Resources that are inspiring his work:

View the full online conversation:

[youtube https://www.youtube.com/watch?v=00WbqeDojP0&w=560&h=315]

Flattr this!

Data is a Team Sport: One on One with Heather Leson

- July 19, 2017 in Community, Data Blog, Event report

Data is a Team Sport is a series of online conversations held with data literacy practitioners in mid-2017 that explores the ever evolving data literacy eco-system.

To subscribe to the podcast series, cut and paste the following link into your podcast manager : http://feeds.soundcloud.com/users/soundcloud:users:311573348/sounds.rss or find us in the iTunes Store and Stitcher.

[soundcloud url=”https://api.soundcloud.com/tracks/333725312″ params=”color=ff5500&auto_play=false&hide_related=false&show_comments=true&show_user=true&show_reposts=false” width=”100%” height=”166″ iframe=”true” /]

This episode features a one on one conversation with Heather Leson, the Data Literacy Lead at International Federation of Red Cross and Red Crescent Societies where her mandate includes global data advocacy, data literacy and data training programs in partnership with the 190 national societies and the 13 million volunteers. She is a past Board Member at the Humanitarian OpenStreetMap Team (4 years), Peace Geeks (1 year), and an Advisor for MapSwipe – using gamification systems to crowdsource disaster-based satellite imagery. Previously, she worked as Social Innovation Program Manager, Qatar Computing Research Institute (Qatar Foundation) Director of Community Engagement, Ushahidi, and Community Director, Open Knowledge (School of Data).

Notes from the Conversation:

Heather talked about the need for Humanitarian organisations to lead their data projects with a ‘do no harm’ approach, and how keeping data and individual information they collect safe was paramount. During her first 10 months developing a data literacy program for the Federation, she focused on identifying internal expertise and providing opportunities for peer exchange. She has relied heavily on external knowledge, expertise and resources that have been shared amongst data literacy practitioners through participating in networks and communities such as School of Data.

Heather’s Resources

Blogs/websites

Heather’s work

The full online conversation:
[youtube https://www.youtube.com/watch?v=Vq7JJE_U7sg&w=560&h=315]

Flattr this!

Data is a Team Sport: Advocacy Organisations

- July 12, 2017 in Community, Data Blog, Event report

Data is a Team Sport is our open-research project exploring the data literacy eco-system and how it is evolving in the wake of post-fact, fake news and data-driven confusion.  We are producing a series of videos, blog posts and podcasts based on a series of online conversations we are having with data literacy practitioners.

To subscribe to the podcast series, cut and paste the following link into your podcast manager : http://feeds.soundcloud.com/users/soundcloud:users:311573348/sounds.rss or find us in the iTunes Store and Stitcher.

[soundcloud url=”https://api.soundcloud.com/tracks/332772865″ params=”color=ff5500&auto_play=false&hide_related=false&show_comments=true&show_user=true&show_reposts=false” width=”100%” height=”166″ iframe=”true” /]

In this episode we discussed data driven advocacy organisations with:

  • Milena Marin is Senior Innovation Campaigner at Amnesty International. She is currently leads Amnesty Decoders – an innovative project aiming to engage digital volunteers in documenting human right violations using new technologies. Previously she worked as programme manager of School of Data. She also worked for over 4 years with Transparency International where she supported TI’s global network to use technology in the fight against corruption.
  • Sam Leon, is Data Lead at Global Witness, focusing on the use of data to fight corruption and how to turn this information into change making stories. He is currently working with a coalition of data scientists, academics and investigative journalists to build analytical models and tools that enable anti-corruption campaigners to understand and identify corporate networks used for nefarious and corrupt practices.

Notes from the Conversation

In order to get their organisations to see the value and benefit of using data, they both have had to demonstrate results and have looked for opportunities where they could show effective impact. Advocates are often quick to see data and new technologies as easy answers to their challenges, yet have difficulty in foreseeing the realities of implementing complex projects that utilise them.

Data provides advocates with ways to reveal the extent of a problem and  provide depth to qualitative and individual stories.  Milena credits the work of School of Data for the fact that journalists now expect Amnesty to back up their stories with data. However, the term ‘fake news’ is used to discredit their work and as a result they work harder at presenting verifiable data.

Data projects also can provide additional benefit to advocacy organisations by engaging stakeholders. Amnesty’s decoder project has involved 45,000 volunteers, and along with being able to extract data from a huge amount of video, it has also provided those volunteers with a deeper understanding of Amnesty’s work.  Global Witness is striving to make their data publicly accessible so it can provide benefit to their allies. Global Witness acknowledges that they are still are learning about ethical and privacy considerations before open data-sets can be a default. Both organisations are actively learning

They also touched on how important it is for their organisations to learn from others. They  look to external consultants and intermediaries to help fill organisational gaps in expertise in using data. They find it critical for organisations like Open Knowledge and School of Data to convene practitioners from different disciplines to share methodologies and lessons learned. During the conversation, they offered to share their own internal curriculums with each other.

More about their work

Milena

Sam

Resources and Readings

From FabRiders

View the Full Conversation:
[youtube https://www.youtube.com/watch?v=Row0OtRhlao]


Flattr this!

Data is a Team Sport: One on One with Daniela Lepiz

- July 3, 2017 in Community, Data Blog, Event report

Data is a Team Sport is a series of online conversations held with data literacy practitioners in mid-2017 that explores the ever evolving data literacy eco-system.

To subscribe to the podcast series, cut and paste the following link into your podcast manager : http://feeds.soundcloud.com/users/soundcloud:users:311573348/sounds.rss or find us in the iTunes Store and Stitcher.

[soundcloud url=”https://api.soundcloud.com/tracks/331054739″ params=”color=ff5500&auto_play=false&hide_related=false&show_comments=true&show_user=true&show_reposts=false” width=”100%” height=”166″ iframe=”true” /]

This episode features a one on one conversation with Daniela Lepiz, a Costa Rican data journalist and trainer, who is currently the Investigation Editor for CENOZO, a West African Investigative Journalism Project that aims to promote and support cross border data investigation and open data in the region. She has a masters degree in data journalism from the Rey Juan Carlos University in Madrid, Spain. Previously involved with OpenUP South Africa working with journalists to produce data driven stories.  Daniela is also a trainer for the Tanzania Media Foundation and has been involved in many other projects with South African Media, La Nacion in Costa Rica and other international organisations.

Notes from the conversation

Daniela spoke to us from Burkina Faso and reflected on the importance of data-driven journalism in holding power to accountability. Her project aims to train and support  journalists working across borders in West Africa to use data to expose corruption and human rights violation. To identify journalists to participate in the project, they seek individuals who are experienced, passionate and curious. The project engages media houses, such as Premium Times in Nigeria, to ensure that there are respected outlets to publish their stories. Daniela raised the following points:

  • As the media landscape continues to evolve, data literacy is increasing becoming a required competency
  • Journalists do not necessarily have a background in mathematics or statistics and are often intimidated by the idea of having to these concepts in their stories.
  • Data stories are best done in teams of people with complementary skills. This can go against a traditional approach to journalism in which journalists work alone and tightly guard their sources.
  • It is important that data training programmes also work with, and better understand the needs of journalists.

Resources she finds inspiring

Her blogs posts

The full online conversation:

[youtube https://www.youtube.com/watch?v=9l4SI6lm130]

Daniela’s bookmarks!

These are the resources she uses the most often.

.Rddj – Resources for doing data journalism with RComparing Columns in Google Refine | OUseful.Info, the blog…Journalist datastores: where can you find them? A list. | Simon RogersAidInfoPlus – Mastering Aid Information for Change

Data skills

Mapping tip: how to convert and filter KML into a list with Open Refine | Online Journalism Blog
Mapbox + Weather Data
Encryption, Journalism and Free Expression | The Mozilla Blog
Data cleaning with Regular Expressions (NICAR) – Google Docs
NICAR 2016 Links and Tips – Google Docs
Teaching Data Journalism: A Survey & Model Curricula | Global Investigative Journalism Network
Data bulletproofing tips for NICAR 2016 – Google Docs
Using the command line tabula extractor tool · tabulapdf/tabula-extractor Wiki · GitHub
Talend Downloads

Github

Git Concepts – SmartGit (Latest/Preview) – Confluence
GitHub For Beginners: Don’t Get Scared, Get Started – ReadWrite
Kartograph.org
LittleSis – Profiling the powers that be

Tableau customized polygons

How can I create a filled map with custom polygons in Tableau given point data? – Stack Overflow
Using Shape Files for Boundaries in Tableau | The Last Data Bender
How to make custom Tableau maps
How to map geographies in Tableau that are not built in to the product (e.g. UK postcodes, sales areas) – Dabbling with Data
Alteryx Analytics Gallery | Public Gallery
TableauShapeMaker – Adding custom shapes to Tableau maps | Vishful thinking…
Creating Tableau Polygons from ArcGIS Shapefiles | Tableau Software
Creating Polygon-Shaded Maps | Tableau Software
Tool to Convert ArcGIS Shapefiles into Tableau Polygons | Tableau and Behold!
Polygon Maps | Tableau Software
Modeling April 2016
5 Tips for Making Your Tableau Public Viz Go Viral | Tableau Public
Google News Lab
HTML and CSS
Open Semantic Search: Your own search engine for documents, images, tables, files, intranet & news
Spatial Data Download | DIVA-GIS
Linkurious – Linkurious – Understand the connections in your data
Apache Solr –
Apache Tika – Apache Tika
Neo4j Graph Database: Unlock the Value of Data Relationships
SQL: Table Transformation | Codecademy
dc.js – Dimensional Charting Javascript Library
The People and the Technology Behind the Panama Papers | Global Investigative Journalism Network
How to convert XLS file to CSV in Command Line [Linux]
Intro to SQL (IRE 2016) · GitHub
Malik Singleton – SELECT needle FROM haystack;
Investigative Reporters and Editors | Tipsheets and links
Investigative Reporters and Editors | Tipsheets and Links

SQL_PYTHON

More data

2016-NICAR-Adv-SQL/SQL_queries.md at master · taggartk/2016-NICAR-Adv-SQL · GitHub
advanced-sql-nicar15/stats-functions.sql at master · anthonydb/advanced-sql-nicar15 · GitHub
2016-NICAR-Adv-SQL/SQL_queries.md at master · taggartk/2016-NICAR-Adv-SQL · GitHub
Malik Singleton – SELECT needle FROM haystack;
Statistical functions in MySQL • Code is poetry
Data Analysis Using SQL and Excel – Gordon S. Linoff – Google Books
Using PROC SQL to Find Uncommon Observations Between 2 Data Sets in SAS | The Chemical Statistician
mysql – Query to compare two subsets of data from the same table? – Database Administrators Stack Exchange
sql – How to add “weights” to a MySQL table and select random values according to these? – Stack Overflow
sql – Fast mysql random weighted choice on big database – Stack Overflow
php – MySQL: Select Random Entry, but Weight Towards Certain Entries – Stack Overflow
MySQL Moving average
Calculating descriptive statistics in MySQL | codediesel
Problem-Solving using Graph Traversals: Searching, Scoring, Ranking, …
R, MySQL, LM and quantreg
26318_AllText_Print.pdf
ddi-documentation-english-572 (1).pdf
Categorical Data — pandas 0.18.1+143.g3b75e03.dirty documentation
python – Loading STATA file: Categorial values must be unique – Stack Overflow
Using the CSV module in Python
14.1. csv — CSV File Reading and Writing — Python 3.5.2rc1 documentation
csvsql — csvkit 0.9.1 documentation
weight samples with python – Google Search
python – Weighted choice short and simple – Stack Overflow
7.1. string — Common string operations — Python v2.6.9 documentation
Introduction to Data Analysis with Python | Lynda.com
A Complete Tutorial to Learn Data Science with Python from Scratch
GitHub – fonnesbeck/statistical-analysis-python-tutorial: Statistical Data Analysis in Python
Verifying the email – Email Checker
A little tour of aleph, a data search tool for reporters – pudo.org (Friedrich Lindenberg)
Welcome – Investigative Dashboard Search
Investigative Dashboard
Working with CSVs on the Command Line
FiveThirtyEight’s data journalism workflow with R | useR! 2016 international R User conference | Channel 9
Six issue when installing package · Issue #3165 · pypa/pip · GitHub
python – Installing pip on Mac OS X – Stack Overflow
Source – Journalism Code, Context & Community – A project by Knight-Mozilla OpenNews
Introducing Kaggle’s Open Data Platform
NASA just made all the scientific research it funds available for free – ScienceAlert
District council code list | Statistics South Africa
How-to: Index Scanned PDFs at Scale Using Fewer Than 50 Lines of Code – Cloudera Engineering Blog
GitHub – gavinr/geojson-csv-join: A script to take a GeoJSON file, and JOIN data onto that file from a CSV file.
7 command-line tools for data science
Python Basics: Lists, Dictionaries, & Booleans
Jupyter Notebook Viewer

PYTHON FOR JOURNALISTS

New folder

Reshaping and Pivot Tables — pandas 0.18.1 documentation
Reshaping in Pandas – Pivot, Pivot-Table, Stack and Unstack explained with Pictures – Nikolay Grozev
Pandas Pivot-Table Example – YouTube
pandas.pivot_table — pandas 0.18.1 documentation
Pandas Pivot Table Explained – Practical Business Python
Pivot Tables In Pandas – Python
Pandas .groupby(), Lambda Functions, & Pivot Tables
Counting Values & Basic Plotting in Python
Creating Pandas DataFrames & Selecting Data
Filtering Data in Python with Boolean Indexes
Deriving New Columns & Defining Python Functions
Python Histograms, Box Plots, & Distributions
Resources for Further Learning
Python Methods, Functions, & Libraries
Python Basics: Lists, Dictionaries, & Booleans
Real-world Python for data-crunching journalists | TrendCT
Cookbook — agate 1.4.0 documentation
3. Power tools — csvkit 0.9.1 documentation
Tutorial — csvkit 0.9.1 documentation
4. Going elsewhere with your data — csvkit 0.9.1 documentation
2. Examining the data — csvkit 0.9.1 documentation
A Complete Tutorial to Learn Data Science with Python from Scratch
For Journalism
ProPublica Summer Data Institute
Percentage of vote change | CARTO
Data Science | Coursera
Data journalism training materials
Pythex: a Python regular expression editor
A secure whistleblowing platform for African media | afriLEAKS
PDFUnlock! – Unlock secured PDF files online for free.
The digital journalist’s toolbox: mapping | IJNet
Bulletproof Data Journalism – Course – LEARNO
Transpose columns across rows (grefine 2.5) ~ RefinePro Knowledge Base for OpenRefine
Installing NLTK — NLTK 3.0 documentation
1. Language Processing and Python
Visualize any Text as a Network – Textexture
10 tools that can help data journalists do better work, be more efficient – Poynter
Workshop Attendance
Clustering In Depth · OpenRefine/OpenRefine Wiki · GitHub
Regression analysis using Python
DataBasic.io
DataBasic.io
R for Every Survey Analysis – YouTube
Git – Book
NICAR17 Slides, Links & Tutorials #NICAR17 // Ricochet by Chrys Wu
Register for Anonymous VPN Services | PIA Services
The Bureau of Investigative Journalism
dtSearch – Text Retrieval / Full Text Search Engine
Investigation, Cybersecurity, Information Governance and eDiscovery Software | Nuix
How we built the Offshore Leaks Database | International Consortium of Investigative Journalists
Liz Telecom/Azimmo – Google Search
First Python Notebook — First Python Notebook 1.0 documentation
GitHub – JasonKessler/scattertext: Beautiful visualizations of how language differs among document types


Flattr this!

Data is a Team Sport: Data-Driven Journalism

- June 20, 2017 in Community, Data Blog, Event report

Data is a Team Sport is a series of online conversations held with data literacy practitioners in mid-2017 that explores the ever evolving data literacy eco-system.

Cut and paste this link into your podcast app to subscribe: http://feeds.soundcloud.com/users/soundcloud:users:311573348/sounds.rss or find us in the iTunes Store and Stitcher.

[soundcloud url=”https://api.soundcloud.com/tracks/328987340″ params=”color=ff5500&auto_play=false&hide_related=false&show_comments=true&show_user=true&show_reposts=false” width=”100%” height=”166″ iframe=”true” /]

In this episode we speak with two veteran data literacy practitioners who have been involved with developing data-driven journalism teams.

Our guests:

  • Eva Constantaras is a data journalist specialized in building data journalism teams in developing countries. These teams that have reported from across Latin America, Asia and East Africa on topics ranging from displacement and kidnapping by organized crime networks to extractive industries and public health. As a Google Data Journalism Scholar and a Fulbright Fellow, she developed a course for investigative and data journalism in high-risk environments.
  • Natalia Mazotte is Program Manager of School of Data in Brazil and founder and co-director of the digital magazine Gender and Number. She has a Master Degree in Communications and Culture from the Federal University of Rio de Janeiro and a specialization in Digital Strategy from Pompeu Fabra University (Barcelona/Spain). Natalia has been teaching data skills in different universities and newsrooms around Brazil. She also works as instructor in online courses in the Knight Center for Journalism in the Americas, a project from Texas University, and writes for international publications such as SGI News, Bertelsmann-Stiftung, Euroactiv and Nieman Lab.

Notes from this episode

Our first conversation on Data-Driven Journalism featured Eva Constantaras, on her work in developing data-driven journalism teams in Afghanistan and Pakistan, and Natalia Mazotte on her work in Brazil. They discussed what they have learned helping journalists think through how they can use data to drive social change. They agreed that good journalism necessarily includes data-driven approaches in order uncover facts and the root causes of societal problems.

Eva strives to motivate journalists to look beyond the fact that corruption exists and dig deeper into the causes and impacts. She has seen data journalists in Europe and North America making a choice to focus, for example, on polling data rather than breaking down the data behind the candidates’ policies. Eva sees this as a mistake and is committed to making emerging data journalists understand why this is problematic. Finally, Eva made a critique of the approach funders take in the field of data literacy, often putting too much emphasis on short-term solution rather than investing in long-term data capacity building programmes. This is something that School of Data has long struggled with from third-party funders and clients alike. It’s clear that more work needs to be done to explaining what short term programmes can and, more importantly, cannot achieve.

Natalia primarily discussed School of Data Brazil’s Gender and Number project. The project was designed to use data to move the discussion on gender equality past arguments based on traditional roles. She is concerned about the growing ‘data literacy’ gap between those with power, government and corporations, and those without power, people living in the favelas. In Brazil, the media landscape is changing as the mainstream are reporting  on ‘what’s happened’ while independent media is doing the more investigative reporting on ‘why it’s happened’.

They wanted to plug:

Readings/Resources they find inspiring for their work.

Resources contributed from the participants:

View the online conversation in full:

[youtube https://www.youtube.com/watch?v=92kAsMxw-Q4]

Flattr this!

De-anonymising Ukraine university entrance test results

- May 26, 2017 in Data Blog

Authors: Vadym Hudyma, Pavlo Myronov. Part 1 of a series on Ukrainian student data.

Introduction

External Independent Evaluation Testing is a single exam is used nationwide to access all public universities.

As detailed in our previous article, the release of a poorly anonymised dataset by organisation in charge of the External Independent Evaluation Testing (EIT) resulted in serious risks to the privacy of Ukrainian students. One of those was the risk of unwanted mass disclosure of personal information, with the help of a single additional dataset. We detail below how we reached our results.

The EIT datasets contains the following dimensions:

  • Unique identifier for every person
  • Year of birth
  • Sex
  • Test scores of every subject taken by student (for those who get 95% and more of possible points – exact to decimals)
  • Place, where test were taken

On the other hands, the dataset we used to de-anonymise the EIT results, was collected from the website vstup.info, and it gives us access to the following elements:

  • family name and initials of the applicant (also referred below to as name)
  • university where the applicant was accepted
  • the combined EIT result scores per required subject, with a multiplier applied to each subject by the universities, depending on their priorities.

At first glance, as every university uses its own list of subject-specific multipliers to create the combined EIT results of applicants, it should be impossible to precisely know their EIT score, as well as find matches with exact scores in EIT data set.

The only problem with that reasoning is that the law requires all the multipliers to be published on the same website as a part of a corruption prevention mechanism. And this is good. But it also provides attackers with enough data to use it as a basis for calculation to find exact matches between datasets.

How we did it

Our calculations were based on an assumption that every EIT participant applied to universities of their local region. Of course, this assumption may not be true for every participant but it’s usually the case and also one of the easiest ways to decrease the complexity of the calculations.

For every Ukrainian region, we isolated in the EIT dataset a subset of local test-takers and calculated the EIT ratings they would have if they had applied for every speciality at local universities. Then we merged this dataset of “potential enrollees” with real enrollees’ dataset from website vstup.info, which contained real names of enrollees and their final rating (meaning multiplied by subject- and university specific multipliers) by the parameters of the university, speciality, and rating.

By joining these data sets for every region we gained the first set of pairs, where test-takers’ ids correspond with enrollees’ names (data set A1B1). In the resulting set, the quantity of EIT participants that correspond with only one name, i.e. those who can be unambiguously identified, is 20 637 (7.7% of all participants).

To expand the scope of our de-anonymization, we used the fact that most of the enrollees try to increase their chances of getting accepted by applying to several universities. We consequently tested all pairs from first merged dataset (A1B1) against the whole dataset of enrollees (B1), counting the number of matches by final rating for the every pair. Then we filtered the pairs that were matched by at least two unique values of EIT rating. If the same match occurs in two cases with different universities/speciality coefficients to form aggregate EIT rating, it’s much less likely that we got a “false positive”.

Therefore, we formed a data set where each EIT participant’s id corresponds with one or more names, and the number of unique EIT rating values is recorded for every correspondence (C1). In this case, the number EIT participant (unique identifier from A1) that correspond only one name with the number of unique aggregate ratings > 1, is 50 845 (18.97%).

We also noticed the possibility of false positive results, namely the situation where the same family name and initials from enrollees dataset (B1) corresponds with several ids from EIT participants dataset (A1). It doesn’t necessary mean we guessed test taker’s family name wrongly, especially in a case of rather common a family name. The more widespread name is, the more the probability that we have correctly identified several EIT participants with the same name. But still it leaves possibilty of some number of false positive results.

To separate the most reliable results from others, we identified correspondences with unique names and calculated the number of the records where unique id corresponds with a unique name.

Consequently, the results of our de-anonymization can be described by the following table.

Assumptions De-anonymized EIT participants with unique names De-anonymized EIT participants (regardless of names uniqueness)
1) Every enrollee applied to at least one university in his/her region. 8 231 (3.07%) 20 637 (7.7%)
1) + Every enrollee applied to at least two specialities with different coefficients. 31 418 (11.42%) 50 845 (18.97%)

In each row, false positive results can occur only if some of the enrollees broke basic assumption(s).

So far we speaking about unambiguous identification of test-takers. But even narrowing results to a small number of possible variants makes subsequent identification using any kind of background knowledge or other available data sets trivial. At the end, we were able to identify 10 and less possible name-variants for 43 825 EIT participants. Moreover, we established only 2 possible name-variants for 19 976 test-takers.

Our method provides assumed name(or names) for every EIT participant, who applied to university in the region where they had taken their tests, and applied to at least two specialities with different multipliers. Though not being 100% free from false positives, the results are precise enough to show that external testing dataset provides all necessary identifiers to de-anonymize a significant part of test-takers. Of course, those who may have personal or business, and not purely research interest in test-takers’ personalities or enrollees external testing results would find multiple ways to make de-anonymization even more precise and wider in its scope.

(NOTE: For example, one can use clusterization of each specialty rating coefficients to decrease the number of calculation avoiding our basic assumption. It is also possible to take into account the locations of EIT centres and assume that test-takers would probably try to enrol at the universities in nearby regions or to estimate real popularity of names among enrollees using social network “Vkontakte” API and so on.)

Using comparatively simple R algorithms and an old HP laptop we have found more than 20 637 exact matches (7.7% of all EIT participants), re-identifying individuals behind anonymized records. And more than 40 thousands – participants were effectively de-anonymised with less than perfect precision – but more than good enough for motivated attacker.

What could be done about it?

After conducting initial investigation, we reached out to CEQA for comments. This was their response:

“Among other things, Ukraine struggles with high level of public distrust to government institutions. By publishing information about standardized external assessment results and the work we deliver, we try to lead by example and show our openness and readiness for public scrutiny…

At the same time, we understand that Ukraine has not yet formed a mature culture of robust data analysis and interpretation. Therefore, it is essential to be aware of all risks and think in advance about ways to mitigate adverse impact on individuals and the education system in general.”

So what could be done better with this particular dataset to mitigate at least the above mentioned risks, while preserving its obvious research value? Well, a lot.

First of all, a part of the problem that is easy to fix is the exact test scores. Simple rounding and bucketing them into small portions (like 172 instead of the range from 171 to 173, 155 for the range from 154 to 156 and so on), and so making them reasonably k-anonymous. Whilst this wouldn’t make massive deanonymization impossible, it could seriously reduce both the number of possible attack vectors and the precision of these breaches. “Barnardisation” (adding 1 and -1 randomly to each score) would also do the trick, though it should be combined with other anonymisation techniques.

The problem with background knowledge (like in the “nosy neighbour” scenario) is that it would be impossible to mitigate without removing a huge number of outliers and specific cases, such as small schools, non-common test subjects in small communities and so on, as well as huge steps in bucketing different scores or generalising test locations. Some educational experts have raised concerns about the projected huge loss in precision.

Still, CEQA may have considered releasing dataset with generalised data and some added noise and give researchers more detailed information under a non-disclosure agreement.

This “partial release/controlled disclosure” scheme could also help to deal with the alarming problem of school ratings. For example, a generalisation of testing location from exact places to school districts or even regions would probably help. Usually, local media wouldn’t be interested in comparing EIT results outside their audience locations, and national media is much more reluctant to publish stories about differences in educational results between different regions for obvious discrimination and defamation concerns.

This kind of attack is not very dangerous at this particular moment in Ukraine – we don’t have a huge data-broker market (as in US or UK) and our HR/insurance companies do not use sophisticated algorithms (yet) to determine the fate of peoples’ job applications or final life insurance cost. But the situation is quickly changing, and this kind of sensitive personal data, which isn’t worth much at this point, can be easily exploited at any moment in the near future. And both the speed and low cost of this kind of attack make this data set a very low hanging fruit.

Conclusions

Current states of affairs in personal data protection in Ukraine, as well as workload of existing responsible stuff in government don’t leave much hopes for a swift change in any of already released data sets. Still, this case clearly demonstrates that anonymisation is really hard problem to tackle, and benefits of microdata disclosure could be quite easily outweighed by possible risks of unwanted personal data disclosures. So, all open data activists advocating for disclosure maximum information possible, as well as government agencies responsible for releasing such sensitive data sets, should put really hard efforts into figuring out possible privacy connected risks.

We hope that our work would be helpful not just for future releases of external testing results, but for the wider open data community – both in Ukraine and throughout the world.

Flattr this!

The lost privacy of Ukrainian students: a story of bad anonymisation

- May 23, 2017 in Data Blog

Authors: Vadym Hudyma, Pavlo Myronov. Part 1 of a series on Ukrainian student data.

Introduction

Ukraine has long been plagued with corruption in the university admission process due to a complicated and untransparent process of admission, especially for state-funded seats. To get it would-be students required not just a good grades from school (which also was subject of manipulation), but usually some connections or bribes to the universities admission boards.

Consequently, the adoption of External Independent Evaluation Testing (EIT) (as the primary criteria for admission into universities is considered one of a handful of successful anticorruption reforms in Ukraine. External independent evaluation is conducted once a year for a number of subjects, anyone with school diploma can participate in it. It is supervised by an independent government body (CEQA – Center for Educational Quality Assessment) with no direct links neither to school system nor major universities, All participant names are protected with unique code to protect results from forgery. {Explanation of the system in 1-2 sentence.}

The EIT has not eradicated corruption, but reduced it to a negligible level in the university admissions system. While its impact on the school curriculum and evaluation is, and should be, critically discussed, its success in providing opportunities for a bright student to get a chance to choose between the best Ukrainian universities is beyond doubt. Also, it provides researchers and the general public with a very good tool to understand, at least on some level, what’s going on with secondary education based on unique dataset of country-wide results of university admission tests.

Obviously, it’s also crucial that the results of the admission tests, a potentially life-changing endeavour, must be held as privately and securely as possible. Which is why we were stricken when the Ukrainian Center for Educational Quality Assessment (CEQA) also responsible for collecting and managing the EIT data, released this August a huge dataset of independent testing results from 2016.

In this case, this dataset includes individual records. Although the names and surnames of participants were de-identified using randomly assigned characters, the dataset was still full of multiple other entries that could link to exact individuals. Those include exact scores (with decimals) of every taken test subject, the birth year of each participant, their gender, whether they graduated this year or not and, most damning, the name of the place where each subject of external examination was taken – which is usually the schools at which participants got their secondary education.

I. Happy Experts

Of course, the first reaction from the Ukrainian Open Data community was overwhelmingly positive, helped with the fact that previous releases of EIT datasets were frustrating in their lack of precision and scope.

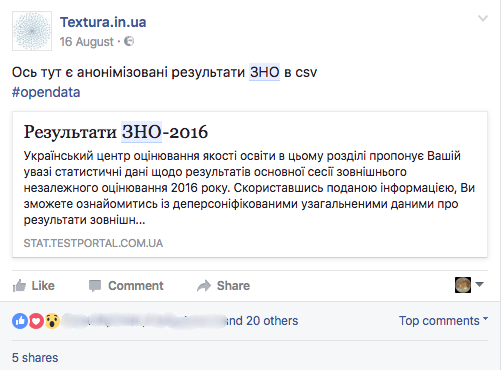
A Facebook post announcing the publication: “Here are the anonymized results of IET in csv #opendata”

image alt text

*A Facebook comment reacting to the publication: “Super! Almost 80 thouthands entries” (actually more ;) *

image alt text

A tweet discussing the data: “Some highly expected conclusions from IET data from SECA…”

As Igor Samokhin, one of the researchers who used the released EIT dataset in his studies, put it:

“[..This year’s] EIT result dataset allows for the first time to study the distribution of scores on all levels of aggregation (school, school type, region, sex) and to measure inequality in scores between students and between schools on different levels.[…] The dataset is detailed enough that researchers can ask questions and quickly find answers without the need to ask for additional data from the state agencies, which are usually very slow or totally unresponsive when data is needed on the level lower than regional.”

Indeed, the dataset made possible some interesting visualisations and analysis.

image alt text

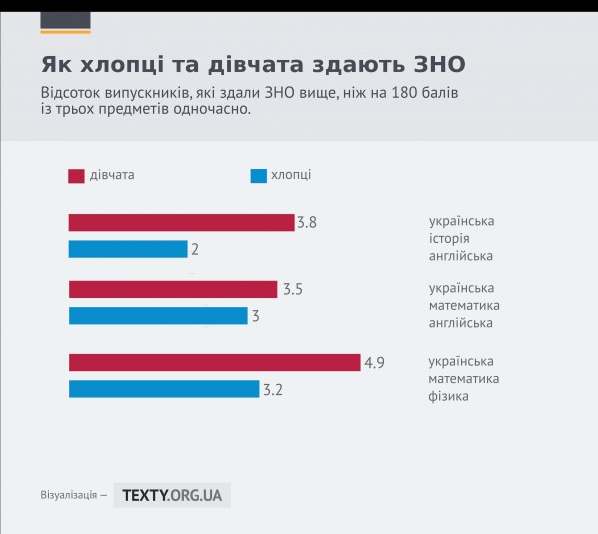
A simple visualisation showing differences in test results between boys and girls

image alt text

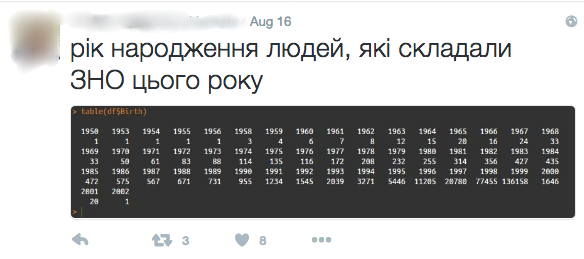
Quick analysis of birth years of those who took IET in 2016

But that amount of data and the variety of dimensions (characteristics) available carry many risks, unforeseen by data providers and overlooked by the hyped open data community and educational experts. We’ve made a short analysis of most obvious threat scenarios.

II. What could go wrong?

As demonstrated by various past cases across the world, microdata disclosure, while extremely valuable for many types of research such as longitudinal studies, is highly susceptible to re-identification attacks.

To understand the risks involved, we went through a process called threat modeling. This consists in analysing all the potential weaknesses of a system (here the anonymisation technique used on the dataset) from the point of view of a potential individual with malicious intentions (called’ attacker’). Three threat models emerged from this analysis:

The ‘Nosy neighbour’ scenario

The first and most problematic possibility is called the “nosy neighbour” scenario. This corresponds to an unexpected disclosure of results from relatives, neighbours, school teachers, classmates, or anyone with enough knowledge about an individual described in the dataset to recognize who the data describes – without having to look at the name. The risks involved with this scenario include possible online and offline harassment against people with too low or too high – depending on context – test results.

Unwanted disclosure may happen because members in the subject’s close environment can already have some additional information about the person. If you know that your classmate Vadym was one of the rare person of the village to take chemistry in the test, you can easily deduce which line of the data corresponds to him, discovering in the same way all the details of his tests results. And depending on what you (and others) discover about Vadym, the resulting social judgment could be devastating for him, all because of an improperly anonymised dataset.

This is a well-known anonymisation problem – it’s really hard to get a good anonymity with that many dimensions – in this case, the subject and exact results of multiple tests and their primary examination location.

It’s an especially alarming problem for schools in small villages or specialised schools – where social pressure and subsequent risk of stigmatisation is already very high.

The ‘Ratings fever’ problem

image alt text

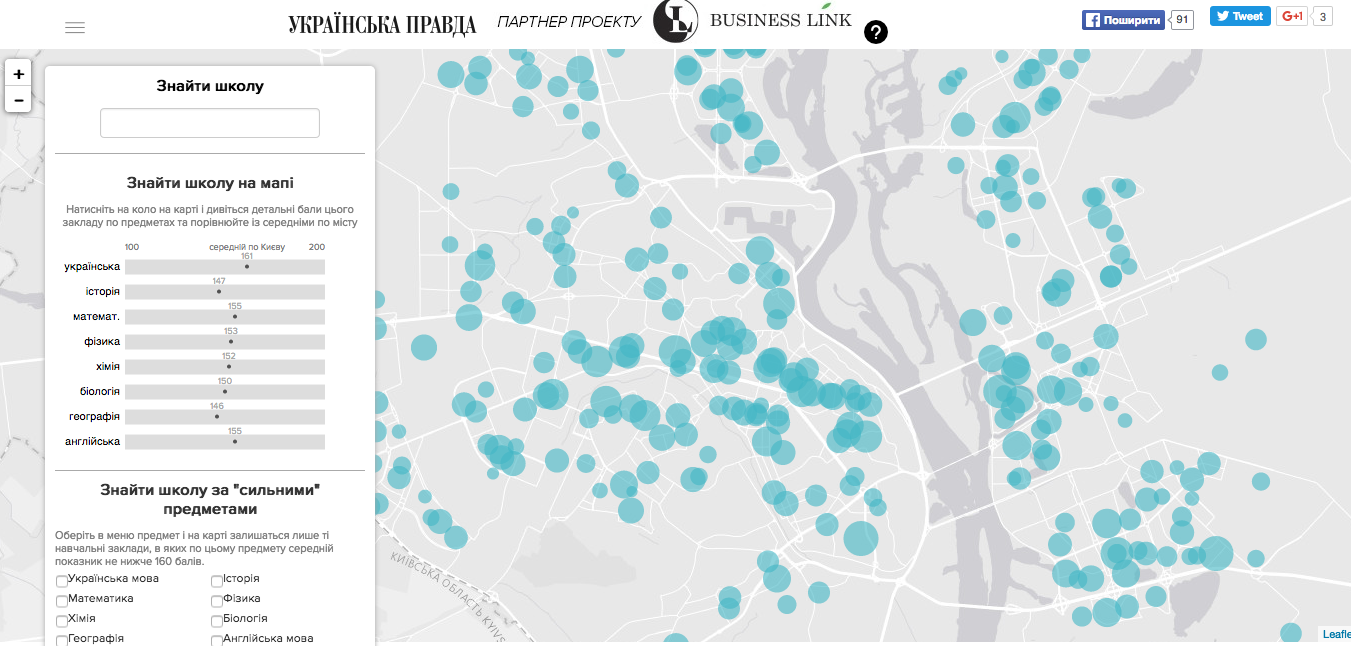
Map of schools in Kiev, Ukraine’s capital, made by the most popular online media based on EIT results

The second problem with educational data is hardly new and the release of this dataset just made it worse. With added precision and targeting power, more fervour was granted to the media’s favoured exercise of grading schools according to successes and failures of the external testing results of its students.

In previous years, many educational experts criticised ratings made by media and the different government authorities for incompleteness: they were based either on a full dataset, but for only one test subject, or were made using heavily aggregated and non-exhaustive data. But such visualisations can have consequences more problematic than misleading news readers about the accuracy of the data.

The issue here is about the ethical use of the data, something often overlooked by the media in Ukraine, who happily jumped on the opportunity to make new ratings. As educational expert Iryna Kogut from CEDOS explains:

“EIT scores by themselves can not be considered as a sign of the quality of education in a individual school. The new dataset and subsequent school ratings based on it and republished by CEQA only maintains this problem. Public opinion about the quality of teaching and parental choice of school relies on results of the EIT, but the authors of the rating do not take into account parents’ education, family income, the effect of private tutoring and others out-of-school factors which have a huge influence on learning results. Besides, some schools are absolutely free to select better students (usually from families with higher socioeconomic status), and this process of selection into “elite” schools is usually neither transparent nor fair. So they are from the start not comparable with the schools having to teach ‘leftovers’. ”

Even as people start understanding the possible harm of the “rate everything” mentality for determining both public policy and individual decisions, almost every local website and newspaper has made or republished school ratings from their cities and regions. In theory, there could be benefits to the practice, such as efforts to improve school governance. Instead, what seems to happen is that more students from higher-income families migrate to private schools and less wealthy parents are incentivised to use ‘unofficial’ methods to transfer their kids to public school with better EIT records. Overall, this is a case where the principle “the more informed you are the better” is actually causing harm to the common good – especially when there is no clear agenda or policy in place to create a fairer and more inclusive environment in Ukrainian secondary education.

Mass scale disclosure

The last and most long-term threat identified is the possible future negative impact on the personal life of individuals, due to the unwanted disclosure of test results. This scenario considers the possibility of mass scale unwanted identity disclosure of individuals whose data were included in recent EIT data set.

As our research has shown, it would be alarmingly easy to execute. The only thing one needs to look at is already-published educational data. To demonstrate the existence of the this threat, we only had to use one data set: close to half of the EIT records could be de-anonymised with varying level certainty, meaning that we could find the identity of the individual behind the results (or narrow down the possibility to a couple of individuals) for one hundred thousand individual records.

The additional dataset we used comes from another government website – vstup.info – which lists all applicants to every Ukrainian university. The data includes the family names and initials of each applicant, along with the combined EIT results scores. The reason behind publishing this data was to make the acceptance process more transparent and cut space for possible manipulations.

But with some data wrangling and mathematical work, we were able to join this data with the IET dataset, allowing a mass scale de-anonymisation.

So what should be the lessons learned from this?

First, while publishing microdata may bring enormous benefits to the researchers, one should be conscious that anonymisation may be really hard and non-trivial problem to solve. Sometimes less precision is needed to preserve anonymity of persons whose data is included in the dataset.

Second – it’s important to be aware of any other existing datasets, which datasets may be used for de-anonymization. It’s responsibility of data publisher to make sure of that before any information sharing.

Third – it’s not enough just to publish dataset. It’s important to make sure that your data wouldn’t be used in obviously harmful or irresponsible manner, like in various eye-catching, but very damaging in the long run ratings and “comparisons”.

Flattr this!