A Quick Peek at Some Charities Data…
As part of the Maximising Your Data Impact launch event of the Civil Society Data Network (reviewed in part by the Guardian here: Open data and the charity sector: a perfect fit), a series of mini-data expeditions provided participants with the opportunity to explore a range of data related questions relevant to the third sector. This was my first data exploration, and rather than deep dive into the data (which I probably should have done!) I was rather more interested in getting a feel for how potential data users actually discussed data related questions.
The topic my group was exploring was how to decide whether it made more sense to make a donation to a small or large charity. Unpacking this question a little forces a consideration of what the donor perceives to be a good use of their donation. To try to make the question more tractable, we also focussed on a particular scenario: how might a donor wishing to contribute to a charity related in some way to the hospice movement draw comparisons between them in order to inform their decision.
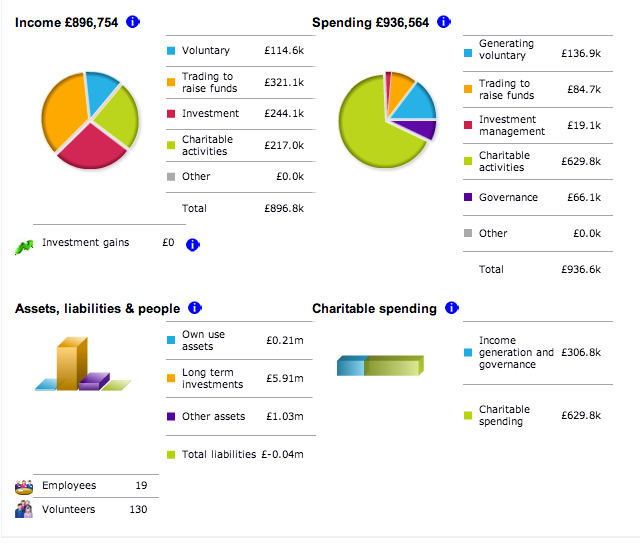
A scan of the Charity Commission website reveals that information is available for many charities relating to the size of the organisation as given by the number of staff or number of volunteers, as well as a certain amount of financial reporting:
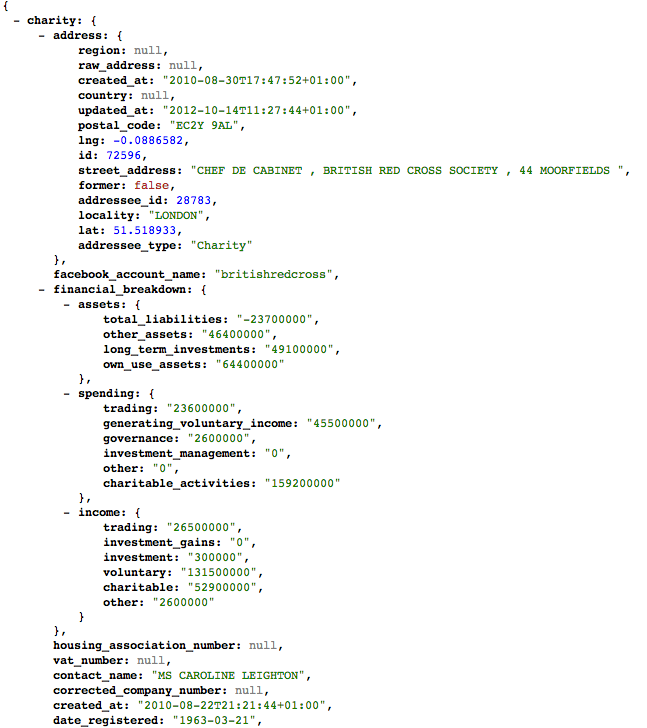
Unfortunately, there doesn’t seem to be a way of comparing charities across a sector, nor does the data appear to be available as such. However, OpenCharities does make the data available in a rather more convenient form (that is, in a machine readable form) at web addresses/URLs of the form http://opencharities.org/charities/OPENCHARITIESID.json.
OpenCharities also publish a CSV file (a simple text based tabular data file) that contains crude summary information about UK registered charities, including such things as the charity name, its OpenCharities ID number, a summary description of each charity’s major activities, its registered address, and its social media profile information. If we grab this data, and pull from it the charities that are of interest to us, we can then use the OpenCharities IDs to create URLs from which we can pull the more detailed data.
Grabbing the CSV data file as charities.csv, we can filter out the rows containing items relating to hospices. From a Linux/Mac terminal command line, we can use the grep tool to grab rows that mention “hospice” somewhere in the line, and then create a new file using those rows appended to the column header row from the original file, putting the result into the file hospices.csv:
grep hospice charities.csv > tmp.csv
head -1 charities.csv | cat tmp.csv > hospice_charities.csv
and then upload the resulting filtered file to a Google spreadsheet.
Alternatively, we could load the whole OpenCharities CSV file into a tool such as OpenRefine and then filter the rows using the text filter on an appropriate column to select just rows mentioning “hospice” within a given column. Using the Custom Tabular Export, we could then upload the data directly to Google Spreadsheet.
Having got a list of hospice related charities into a Google Spreadsheet, we can Share the spreadsheet and also publish it (form the File menu). Publishing Google Spreadsheets makes the data available in a variety of formats, such as CSV data, via a web location/URL.
Our recipe so far is as follows:
– get CSV file of charities on OpenCharities;
– filter the file to get charities associated with hospices;
– upload the filtered file to Google Spreadsheets;
– publish the spreadsheet so we have it available as CSV at known URL.
The next step is to grab the more detailed data down from OpenCharities using the OpenCharities ID to construct the web addresses for where we can find that data for each hospice. We could use a tool such as OpenRefine to do this, but instead I’m going to write a short programme on Scraperwiki (OpenCharities Scraper) using the Python programming language to do the task.
#We need to load in some programme libraries to make life easier
import scraperwiki,csv,urllib2,json

#Here's where we load in the spreadsheet data published on Google Spreadsheets as a CSV file
charities = csv.DictReader((urllib2.urlopen('https://docs.google.com/spreadsheet/pub?key=0AirrQecc6H_vdFVlV0pyd3RVTktuR0xmTTlKY1gwZ3c&single=true&gid=1&output=csv')))

#This function will grab data about a charity from OpenCharities given its OpenCharities ID
def opencharitiesLookup(id):
    url = 'http://opencharities.org/charities/'+id+'.json'
    jsondata = json.load(urllib2.urlopen(url))
    return jsondata

#This routine cycles through each row of data/charity pulled from the spreadsheet
for charity in charities:
    #print charity

    #For each charity, I'm going to pull out several data fields that we'll then save to a database of our own
    #We start with some info from the spreadsheet - charity ID, name and activity summary
    data={'cid':charity['charity_number']}
    for tmp in ['title','activities']:
        data[tmp]=charity[tmp]

    #Here's where we pull in the more detailed data for each charity
    jdata = opencharitiesLookup(charity['charity_number'])

    #Then we start to go hunting for the data...
    chdata = jdata['charity']
    fdata = chdata['financial_breakdown']

    #The data will include employee and volunteer numbers..
    for tmp in ['volunteers','employees']:
        data[tmp] = chdata[tmp]

    #...as well as financial information
    for tmp in ['assets','spending','income']:
        if fdata != None and tmp in fdata:
            for tmp2 in fdata[tmp]:
                data[tmp+'_'+tmp2] = fdata[tmp][tmp2]
    #print data

    #Here's where we save all the data for a charity to a database
    scraperwiki.sqlite.save(unique_keys=['cid'], table_name='hospices', data=data)
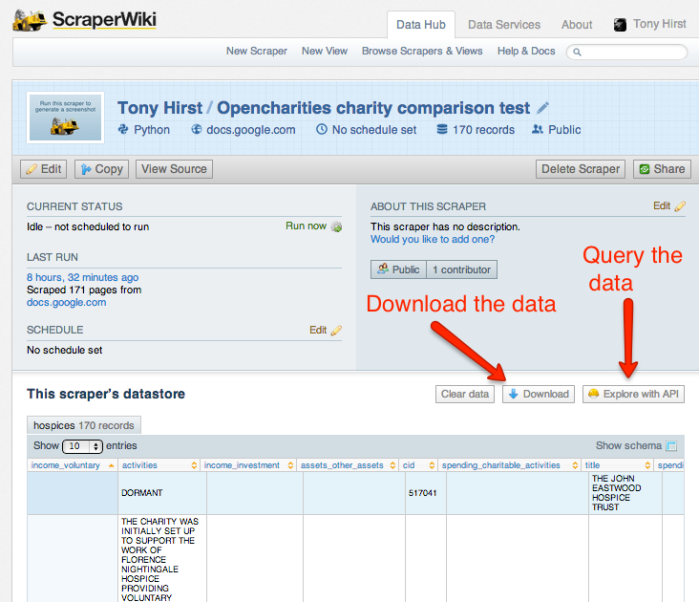
When we run the scraper, it looks up the hospice data in the Google Spreadsheet, gets the richer data from OpenCharities, and pops it into a local database on Scraperwiki from where we can download the data:
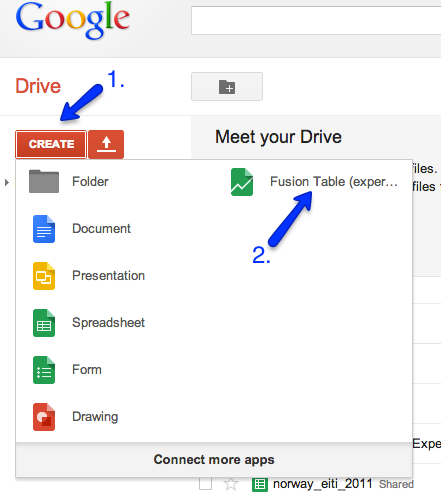
We can now download this enriched data as a CSV file and then, from Google Drive:
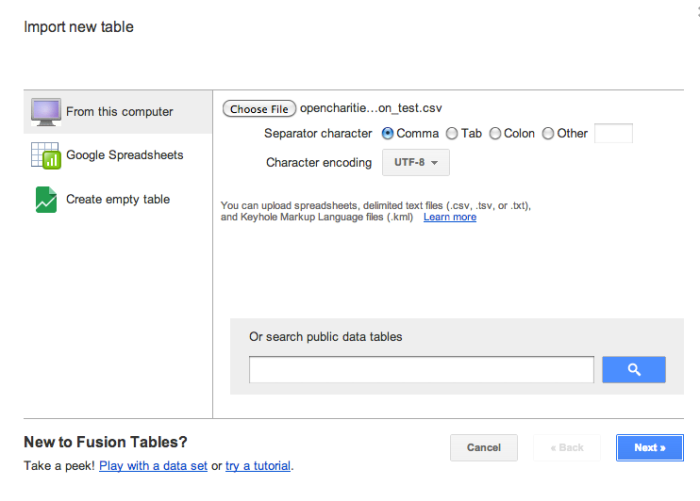
upload it to Google Fusion tables.
The recipe has now been extended as follows:
– pull the list of hospices into Scraperwiki from the Google Spreadsheet
– for each hospice, create an OpenCharities URL that points to the detailed data for that charity
– for each hospice, grab the corresponding data from that OpenCharities URL
– for each hospice, pull out the data elements we want and pop it into a Scraperwiki database
– download the database as a CSV file that now contains detailed data for each charity
– upload the detailed data CSV file to Google Fusion Tables
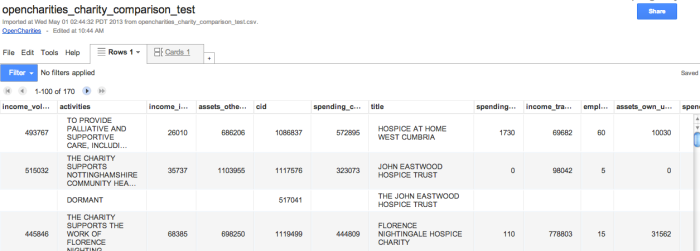
With the data in Google Fusion Tables, we can now start to analyse it and see what stories it might have to tell:
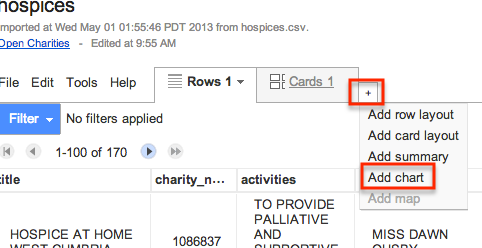
We can then start to build charts around the data:
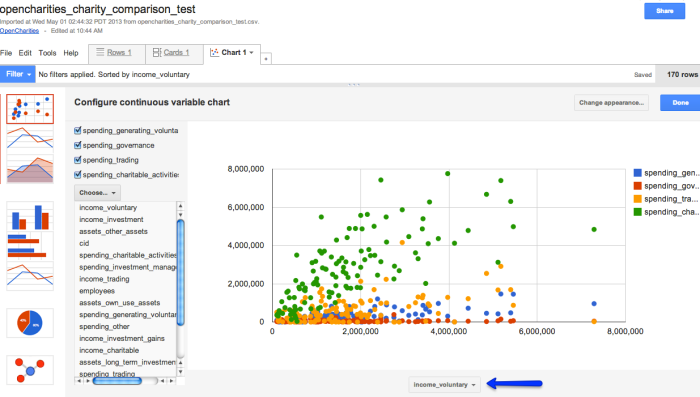
Using the chart builder, you can specify which quantities to plot against each axis:
(?I don’t know how to associate the title column (name of each charity) with points on the chart, so that when we hover over a point we can see which charity it relates to?)
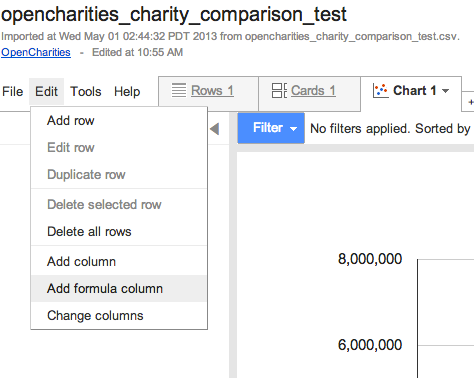
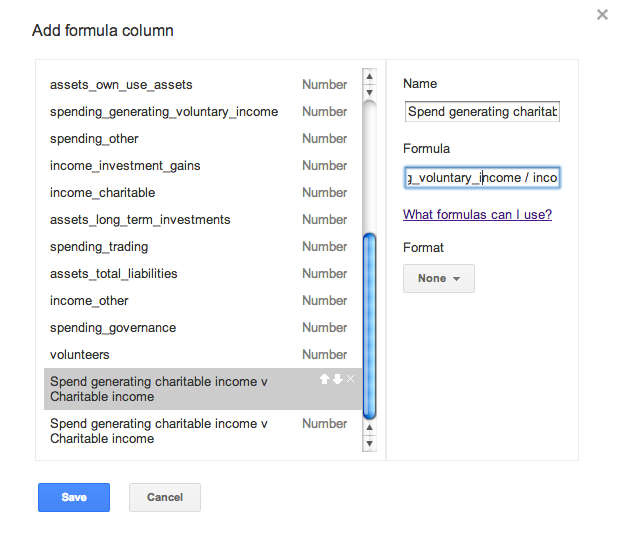
We can also define out own calculations, much as you would in a spreadsheet.
For example, we might be interesting in knowing the ratio of income received from voluntary contributions versus the amount spent soliciting voluntary contributions. If this ratio is greater than 1, more money is spent soliciting these contributions than is received as a result. If the ratio is small (close to zero) then either the money spent soliciting voluntary contributions is effective, or voluntary income is being generated by other other means…
We can then use one or more filters to explore which hospices meet different criteria. For example, how about organisations that seem to get a good voluntary income return versus spend on generating voluntary income, with the proviso that the voluntary income is less than £250,000:
Along similar lines, we might want to calculate the ratio of volunteers to employees, and then then view the data for organisations with a certain number of employees (10 to 50, for example), or a certain number of volunteers (less than 500, say).
This is now the point at which story making – story generation, and data story telling – can start to kick in, based on the questions we want to ask of the data, or the stories we want to try to get it to tell us…

