Data MOOC: Results, Findings and Recommendations
Vanessa Gennarelli - June 25, 2013 in Data Expeditions
From mid-April to mid-May, we collaborated with our friends at the Open Knowledge Foundation to launch the “Data Explorer Mission” using the Mechanical MOOC platform. The Mechanical MOOC was built to form more intimate small learning groups around open educational resources. This was the first time we had used it for team-based projects with synchronous meetings. Here are our findings from the experiment.
Overview
- The “Data Explorer Mission” was designed as an introduction to working with data.
- Learning outcomes were: data cleaning, data analysis, facilitation, visualization and storytelling.
- 151 “Data Agents” signed up.
- Group formation: teams were put together based on time zone: we formed 13 cohorts of 10 learners each (more or less).
- Communication: teams received 2 emails per week–1 with an assignment, and 1 with a script for their synchronous meeting.
- Tools: teams were prompted to schedule their own weekly Google hangout.
- 5 Badges were designed for learners to apply for feedback on their projects.
- Support team (a.k.a “Mission Control”) comprised of one subject-matter expert (Neil Ashton) one data community manager (Lucy Chambers) and one learning designer (Vanessa Gennarelli)
Results
Our findings consist of 3 main datasets:
- Logs of emails from Data Agents to each other (we’ll call this set “Intergroup Emails”)
- Content of email conversations amongst participants
- Qualitative post-course survey results
Intergroup Emails:
In our 13 groups, we tracked how many emails Agents sent to each other. The results were quite surprising:
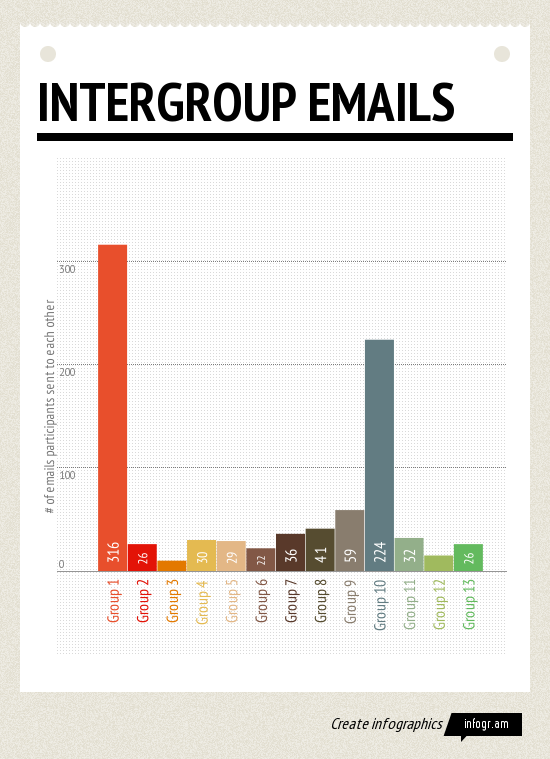
The full dataset for this chart can be found here: http://ow.ly/m1YCp
You’ll notice that most groups emailed each other around 30 times. Two groups, Group 1 and Group 10 emailed each other more than 220 times over the trajectory of the course. What made these groups different?
Content of Email Conversations:
Since this was our first collaborative, project-based Mechanical MOOC project, we approached it as a pilot. As such, the 3 support folks behind Mission Control masqueraded in all of the groups as they evolved. To find out what set Groups 1 and 10 apart, we combed through the content of those conversations. This is what we found:
Team 1
Upon closer inspection, many of these emails discussed trying to find a time to meet. After the first 10 days, the conversation dropped off, so these results are inflated.
Team 10
In looking at the conversations from the most successful Team, several fascinating trends emerged that led to Team 10 to build social presence and cohere as a group.
- Core team: 4 of the 10 original members were active, encouraging each other to keep up with the Mission.
- Spontaneous prompts to check in: Members sent short messages to each other to keep the course alive, i.e. “Are you doing alright? Haven’t heard from you in ages” “Just making some noise.”
- Familiarity: Agents referred to each other by name (as opposed to “Team 10”) and shared bits of contextual information about their lives, such as when they found time to do the assignments, where they were traveling, etc.
- Building upon shared interest: Team 10 shared content related to the subject matter of the course that others might find interesting–such as other Data MOOCs, White House open data, etc.
- Tried new tools together: Agents tried out new tools like Google Fusion Tables together, and shared their frustrations, setbacks and successes.
- Summaries of Hangouts: In a brilliant move, Agents sent a summary of the synchronous Hangout to the whole group, which kept the folks who couldn’t make it in the loop.
What’s notable about Team 10’s interactions is that all four of the core group members were about equally active–this is an example of true group facilitation. We’ll recommend using Team 10’s interactions as a model or a roadmap for future Mechanical MOOC projects.
Overall Team Activity
It’s also worth noting that 3 groups continued to email each other after the course officially ended. Even if they had not finished the project, they had built a community around data, and continued to share resources and review each other’s work.
This made us realize that perhaps we should experiment with time, or folks should be able to progress at their own pace. Another realization was that we should keep the small listservs up so that people can continue to tap their small learning community.
Survey Data:
After the Mission ended, we surveyed Agents about what they felt they learned in the Mission, which tools were most valuable, and about their level of satisfaction with the experience. In the results, we found that many respondents were looking for a more traditional, direct instruction MOOC experience. We need to make the peer learning approach clearer–that Agents were in charge of directing their own learning, that expertise would emerge from working together as a group, and not from an Instructor or a series of Teaching Assistants. This is important, because the Teams that embraced the peer learning approach fared far better in the Data Mission:
- “Apart from learning the basics of working with Google Spreadsheets (including some cleaning, formatting and visualising) and some other tools, I got my first and very impressive experience of P2P-learning.”
- “I would recommend the Data Explorer Mission, because it is a good starting platform, to my mind. What is also important, it’s one of the formats that fosters p2p networking for potential future cooperation, which is very important.”
- “It’s a great learning opportunity, but you take out only as much as you give. The amount of learning depends largely on the work each individual is willing to do.”
As mentioned above, participants who had yet to be “onboarded” to peer learning expressed frustration at the lack of structure and direction in the experience:
- “After reading more about p2p learning and its various methods, I can only say that the my experience would probably be less frustrating if I knew something about its specific in advance.”
- “Make it clear to to ‘beginners’ that there is no right or wrong answers involved in this Mission, but any exploration of the data given is acceptable.”
- “Before the team became interactive, it took quite a bit of effort to organise its cooperation. When people of different cultural backgrounds come together for the first time, they might feel shy and don’t know how to behave. For instance, the team had been keeping silent for more than a week and everybody, as it turned out before, felt frustrated, because there was no visible team or work at all. In fact, it was not because people weren’t doing anything. It was because they were trying to do, failed and didn’t share their negative experience. They thought they only could communicate when they had some positive results. Later we decided that in order to keep our teamwork we’ve got to stick together an share not only our achievements, but also concerns, problems or even just write a few words like ‘hi, I’m in’. That’s not all that obvious.” (Our italics).
Findings & Recommendations
- Google Hangouts. These worked well as a tool. 12/13 groups held at least one hangout. But we should schedule these beforehand, so the path is clearer.
- Onboarding to Peer Learning. Some scaffolding is needed here to prime learners about what to expect. The first exercise should be to examine peer learning and define it for yourself. We’ve updated our Create a Course content to reflect these findings.
- Facilitation. We should use Team 10’s framework to support distributed facilitation. It is our hope that a stronger onboarding process to peer learning will progress in that direction.
- A Sense of the Wider Learning Community. Lots of learners asked for a forum to go to with questions, how many people were in their group, and more of a meta sense of “what was going on.” We could solve this by visualizing group data to learners and contrasting it with the wider community in a weekly message or blog post. And in the future, we could leverage Open Knowledge Foundation’s Q&A engine for questions that the groups cannot answer themselves.
- Timing. We broadcasted the content, instead of working with the context of each individual group, and some folks needed more time. Design a more flexible flow where learners *ask* for the next unit or module. That way they don’t feel like the course has left them behind and they have to drop out if they aren’t “keeping pace.”
- Integrate Badges. We developed a series of Badges for this experience on our platform, but they weren’t used. We need to integrate these better and show learners the value of submitting a project for feedback.
Validity and Limitations
Data collection. We’ll admit candidly: we were learning along with the Data Agents. This was one of Peer 2 Peer University’s first attempts at using Mailgun to track engagement, and there are a few things we could do better. In the future, we will use the “Campaigns” feature to drill down into per group and per user opens / click throughs / replies to the group. We also struggled to get an export of the engagement data on a more regular basis, which would have helped us support groups that were flagging.
Sample size. With a pilot of 150 folks, Teams of Data Agents were spread thin across the world. Some groups, like those in Fiji or Australia, got placed with the nearest-by folks–sometimes 3-4 hours away. With a larger group, Teams will have more local folks in their Mission.
Avenues for Future Projects
From our pilot experience and lessons learned, we’ll be running another iteration of the Data Explorer Mission in August that will include a clear onboarding process for peer learning, stronger support for facilitation, and integrating the “Ask School of Data” to support Agents who have questions their Team cannot answer. Stay tuned for more details.
![]()

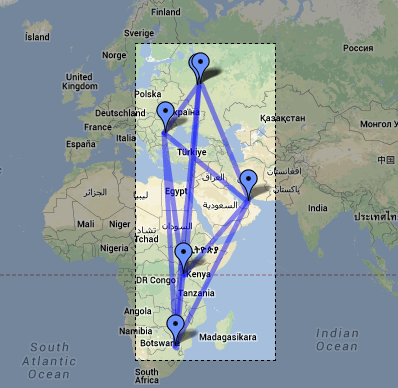
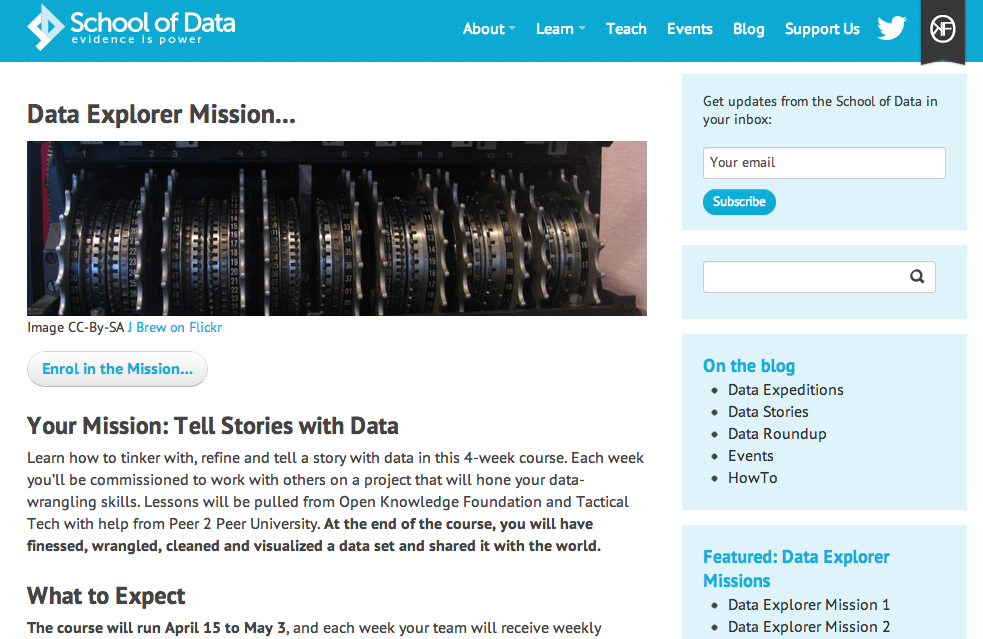

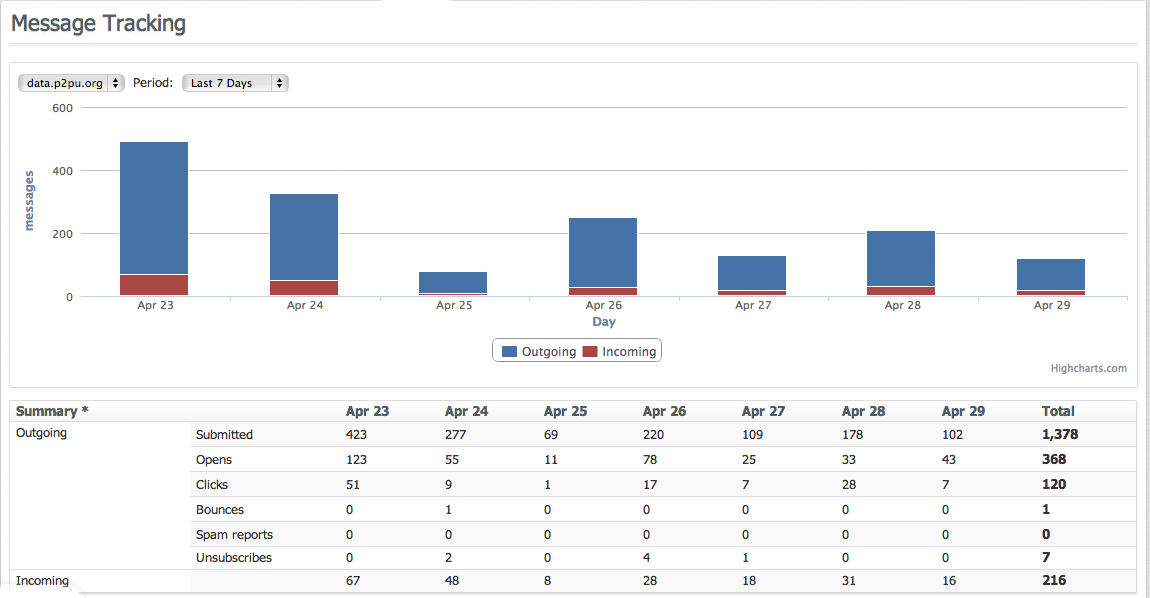
 Image CC-By-SA
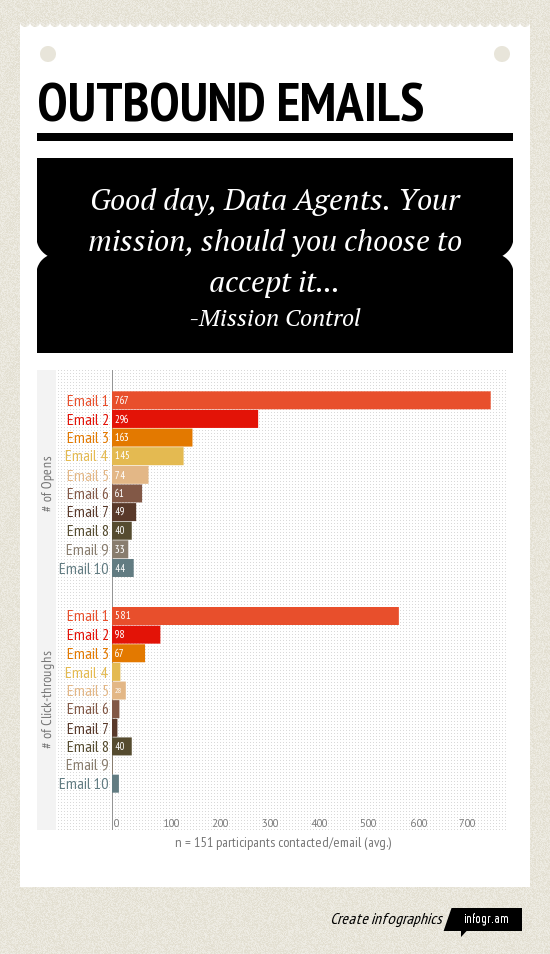