You are browsing the archive for Yuandra Ismiraldi.

Talking about Open Data in Digital Democracy Meetup Indonesia

- January 19, 2015 in Community, Events

In the middle of December, the Indonesian Digital Democracy Forum organized a large meetup for Indonesian digital activists who are involved in the movement for pushing democracy in Indonesia via digital media. The meetup was a two day event that was attended by about 30-50 digital activists, from various backgrounds. The meetup was organized as a kind of mini-conference, where there were several breakout rooms, each with different sessions focusing on specific digital democracy themes, such as open data, or internet freedom.

On the theme of open data, there was a very interesting discussion on how the open data movement can help in strengthening digital democracy in Indonesia. One of the examples shown is the story of KawalPemilu , a platform for voter count verification which uses crowdsourcing; it was created by just five poeple, and yet played a pivotal role in Indonesia’s 2014 presidential election as a checking mechanism for the voter count. The platform allows citizens of Indonesia to see and verify the voter count of the election and to check if anything is amiss. It stood as a strong example of citizen participation in the Indonesian elections.

Regarding the state of open data more generally in Indonesia, there was an overall acknowledgement that the movement is still in early stages. There is still a lot of need to raise awareness regarding the importance and usage of it, as well as skills around how to actually work with the data. Also notable in the discussion is the importance of collaboration between the various open data actors from both the supply and demand side such as government, CSO, and citizens.

Meetups like these provide a great platform for these actors in the open data space to actually connect and collaborate with each other – having these more frequently would strengthen the movement as a whole.

Flattr this!

Code For Bandung – What, Why, and How to Work with Open Data

- December 8, 2014 in Community, Events

Last Friday the Code for Bandung, a local movement of techies and developers who are trying to create civic apps for the City of Bandung, Indonesia. The group took its inspiration from the Code for America and conducted its first community meetup in a coworking space in Bandung called Co n Co. I was there together with a local community data champion Prasetyo Andy Wicaksono to share about the usage of open data both in social and business sense.

The purpose of this event is twofold. The first is to introduce the Code for Bandung movement to the people of Bandung and the second is to give an insight how the people of Bandung can use data especially open data for civic technology. The second purpose is very important because right now awareness regarding the usage of data for civic tech is still low, even in the technology community. There are currently many effort in the field of data based decision for business but for things like civic tech based on data is still pretty much undeveloped.

In the event, we talked about things such as: what is data and open data; why those are important; examples of civic tech apps using data that is publicly available; etc. One example of such project was the water height in the city water canal which gives early warning information for flood alert. Besides civic tech usage, we also discussed about making a start-up with publicly available data, and continued with listing and searching what kind of data actually can be provided by the government of Bandung and can be used to create a useful solution.

The event covered some interesting topics. It is a nice and refreshing perspective to see how data can used for social and civic goals from the perspective of the technology people. It brings to mind that sometimes the most creative uses of data can be achieved by combining the perspective of many different people from different backgrounds, such as from the government, technology, and advocacy.

Flattr this!

Data 101 Knowledge Sharing with Publish What You Pay Indonesia

- December 5, 2014 in Data for CSOs, Events

Starting in August the School of Data Fellow for Indonesia, Yuandra Ismiraldi working together with Publish What You Pay Indonesia organized a weekly / bi-weekly event of knowledge sharing regarding data skills. This knowledge sharing event is free and open for all, so people can just come and learn various skills about working with data.


Data PipelineThe skills shared are mainly the detailed and technical version of the data pipeline concept of the School of Data:

  • Finding & getting data: Google advanced search, use of data portals, using Tabula to get data from PDFs
  • Cleaning data: data cleaning principles, using Open Refine to clean up messy data
  • Analyzing data: Excel, Tableau
  • Visualizing data: visualization principles, Infogr.am, Piktochart, etc
  • And a lot of other data related stuff: spatial data, examples of advocacy using data


The event is more focused on discussions around each topic. The School of Data Fellow first gives a short presentation about the topic and continues with technical hands sessions or with a discussion based on a case study, depending on the topic. With these kinds of knowledge sharing, hopefully that CSOs such as PWYP Indonesia will have a more hands on experience on working with data.

PWYP Indonesia Extractive Industries Infographic

Right now the knowledge sharing has been done about 10 times, with some encouraging results. PWYP Indonesia began to use data more thoroughly as the underlying base for some of their advocacy program and have created some infographics in order to better communicate their data better. Hopefully, knowledge sharing like this can continue and better support CSOs in using data for their advocacy uses.

Flattr this!

PizzaData : Let’s talk data over pizza !

- December 4, 2014 in Community, Events

Data-related communities in Indonesia are still very rare and can be counted on the fingers of one hand, but in November a new data community in Indonesia was born, and that is the Pizza Data. Based in the city of Bandung, Indonesia, the Pizza Data community took up its inspiration from the Ngopi Data community in Jakarta that is initiated by OFKN Ambassador Indonesia, Ramda Yanurzha and taken to Bandung with the help of School of Data Fellow Indonesia, Yuandra Ismiraldi and a local community data champion Prasetyo Andy Wicaksono

Pizza Data Indonesia Bandung First Event

The concept of the Pizza Data community is simple : Talking about data while enjoying a slice of pizza. The first meetup was held in a co-working space in Bandung Co n Co and supported by many communities in Bandung such as Hackerspace Bandung and FOWAB . It was a fun meetup ! Eventbrite tickets were sold out, the room was fully booked and there were many people from a diverse background such as academia, business, government and social movements like Code For Bandung .

It is interesting when people from mixed backgrounds like that gather around in a room and then talk about their experiences working with data. We heard stories about the how the government collects and uses data in Indonesia, stories about how businesses uses their data and how they play with data to take business decisions based on it, and of course about the usage of data in civic tech apps. Everyone was eager to learn and share their skills, making this a very good mix of people.

Overall, it is a great first meetup that serves as a good way for the Pizza Data community going forward. Hopefully the community will grow and spread to other Indonesian cities so the knowledge and awareness about data will spread to as many people as possible in Indonesia.

Flattr this!

Open Data Club – Talking about data with CSOs in Indonesia

- December 3, 2014 in Community, Data for CSOs, Events

Back in September, the School of Data conducted a training for CSOs working with election data in cooperation with Perludem and supported by The Asia Foundation. The training was the kick off of an initiative aiming to create a community of Indonesian CSOs that are interested in working with data to strengthen their advocacy strategy. This is how the Open Data Club was born in the end of October.

Meetup of Open Data Club of CSOs in Jakarta

Meetup of Open Data Club of CSOs in Jakarta

The Open Data Club membership was open for all CSO interested in working with data. Right now the meetings are concentrated in Jakarta but as the community gaining more momentum it will try to do the meetup in other cities as well. Need to be noted that this is might the first data-related community of CSOs, so this is a great start for data awareness for CSO in Indonesia. Right now there are more than 10 organizations took part in the meetups, including some goverments and funders.

The first meetup, initiated by Perludem, had quite a mixed group, ranging from CSOs, goverment, and other data focused movements. However the focus is still on how to use data for advocacy, a theme that CSOs are very interested in. There was a lot of talking about how CSOs can get data, manage and analyse it and finally use it to for storytelling and evidence based campaigning in the form of infographics or interactive apps. One important point that also has been raised is how CSOs can collaborate and potentially combine their data and push more for knowledge sharing and collective advocacy.

The Open Data Club became a weekly meetup in which the participating CSOs take turns in hosting the event. This means that they all visit the offices of all participants CSOs and get to know each other a little better. One more interesting thing is that the CSOs are starting to bond and create action plans (called bubbles) of things they want to achieve through the meetups. By doing this, hopefully after several meetups there will something concrete that the Open Data Club can create and build together.

The Open Data Club marks something quite important for CSO in Indonesia. It shows that interest and awareness on working with data is gaining ground in Indonesia and the CSOs are starting to collaborate and work together for the greater good. Let’s hope this great community can create great things in the future!

Flattr this!

Launching of the Indonesia Data Portal

- November 11, 2014 in Events

Indonesia Data Portal Launch


Exciting news comes from the developing country that is Indonesia: a new data portal! As one of countries with the biggest populations in the world, as well as one of the most varied in terms of culture, one can only imagine what kind of data that Indonesia has. And last September with the launching of the Indonesian national data portal, we finally got a glimpse of that treasure trove of data.

The Indonesian national data portal project started as an effect of Indonesia becoming the Chair of the Open Government Partnership initiative in 2013; holding this position, the Indonesian government started pushing for more domestic projects on open government. As it turned out, one of them happened to be the national data portal. The national data portal project is done under the care of the presidential unit for monitoring, control, and oversight (UKP4), a special unit that has been given presidential mandate to monitor and evaluate government agencies that have been created under the previous president of Indonesia, Susilo Bambang Yudhoyono. The project is also supported by international agencies such as the World Bank.

After much effort, the Indonesian national data portal, aptly named data.id, finally launched! It now host 816 datasets from 24 state institutions & local governments and consisted of many kinds of data such as development data, health data, economic data, and demographic data of Indonesia. All the data is currently licensed under Creative Commons Attribution 2.0.

The launching of the Indonesian data portal marks a very interesting starting point for Indonesians. It shows that data is starting to be regarded as something that has high value for the Indonesian people, and by using the data portal they have started to collect all the data in an organized manner and opened it up freely to everyone. There is still much to do however, with the datasets mainly submitted by a small subset of the state institutions and the local governments; also, all the data is currently in Indonesian only, but nevertheless, it is a good first foray for Indonesians into the world of data.

Check the Indonesia data portal here : data.id

Flattr this!

National Training on Working With Data For Extractive Industries in Indonesia

- November 7, 2014 in Data for CSOs, Events

Capacity Building Workshop for Publish What You Pay Indonesia

Following on from the Capacity Building workshop held in September 2014 with Publish What You Pay Indonesia (PWYP Indonesia) and supported by South East Asia Technology & Transparency Initiative (SEATTI) – HIVOS, at the beginning of October, I helped lead a a two day national training regarding extractive industries data for CSO in Indonesia, with the same audience. Done in parallel with the national work meeting of the PWYP Indonesia coalition of CSOs, the training was focused on raising awareness of data usage and giving the basics on how to work with data for CSOs in the extractive industries sector in Indonesia. The two day training attracted 20+ participants from various CSO that joined in the PWYP Indonesia coalition and by the end of training we hoped they would have their own data project to continue working on.

The First Day

The first day was dedicated to learning the basics, and the theory! In the beginning, the participants are being given the rough theory and basic stuff on how to work with data & data usage, that is based primarily on the School of Data’s data pipeline. The concept of data work in the pipeline (asking a question, finding data, getting data, cleaning data, analyzing data, and visualizing data) also became the building blocks of the training.

After the participant got a heavy dose of the basic stuff regarding how to work with data, then we went straight into the technical how-to’s, and got their hands dirty. We talked about how to finding data using Google’s advanced search, using the newly launched Indonesian Data Portal data.id, how to create their own forms using Google Docs, and how to get data from PDF using tools like Tabula. After they got their hands full of finding & getting data, then we went to the next step of cleaning data by showing them what we mean by ‘messy data’, and exactly what kind of clean data that they want to achieve in order for the data to be usable, and re-usable by others.

As a session bonus in the end to close the first day, the participants were given a sample demonstration on how they can easily analyze their social media data using Wolfram Alpha. It was really a lot of stuff to chew on the first day, because it was so full of the basics, but the participants felt excited, and a silver lining that can be taken from this session is that actually a lot of the data pipeline concept has already been done by the CSO in their everyday work; the only difference, however, is that they weren’t (yet!) understanding it in terms of the big picture. To understand their work flow better, looking at it through the ‘data pipeline’ framework really helped.

The Second Day

On to the second day!

The second day was done in parallel with the PWYP’s national seminar, and the data training track was put after the keynote and panel discussion regarding transparency in the extractive industries area. Even though the data training session was optional, and scheduled for the afternoon, this did not hinder the energy of the participants of the data training. The session was just packed as the first day’s session!

The materials for the second day focused more on the actual implementation of the theory of the data pipeline that we went through on Day 1. The participants were introduced to the concept of data visualization and the tools that they can use for visualization, then using these tools and everything that was covered on Day 1, they were encouraged to try and create a data project plan using the pipeline as a template.

As always with visualization, the participants were very interested and active in this session. Inevitably, we had a couple of minor glitches regarding internet connectivity, and it came up that some of the visualisation tools that we recommended actually needed an internet connection, but nevertheless the the session turned out nicely offline. After the “Creating your own data project” session facilitated by the PWYP Indonesia team, there was much discussion – which even continued after the time for the training has ended. Such incredible energy for data training!

Recap

Overall, there was a lot of interest in the technique of how actually to work with data, and how the usage of data can help the CSO groups to improve their advocacy work. This was great to see – because once you start to learn that data can help you, you will be hooked to learn more and more about data and how to work with them :)

Flattr this!

Capacity Building Workshop for Publish What You Pay Indonesia

- November 6, 2014 in Events

Capacity Building Workshop for Publish What You Pay Indonesia

In early September, I participated in a workshop together with the Publish What You Pay Indonesia (PWYP Indonesia) coalition, a collection of CSO working for transparency in the extractive industries, and supported by the South East Asia Technology and Transparency Initiative (SEATTI). We focused on how to create and leverage transparency in the extractive industries based on open data and what is the best way to do it – or, the EIOpenData movement.

The workshop provided an introduction to the world of open data, and we looked at how to work with data to create transparency and openness in the extractive industries. It started off with a session from the Indonesian Information Commission on actually how people can create Freedom of Information requests (FoI), which is a useful way to get data from public bodies. Afterwards, the discussion continued with a representative from the Presidential Unit for monitoring, control, & oversight (UKP4) talking about their new plans regarding the Indonesia Data Portal and how they plan to support transparency.The attendance of speakers from the government clearly showed that there is buy-in from the Government of Indonesia (GoI) to support transparency and data use in Indonesia, which is very exciting.

Data Pipeline
Following directly after that was a panel discussion where I talked about the data pipeline and how to work with data, together with a representative from PWYP Indonesia who talked about Extractive Industries Transparency Initiative (EITI) data, which is an international movement that push for transparency in extractive industries domain, especially budget data. We were also joined by a representative from the Web Foundation to talk about open data solutions.

The discussion that followed was an exciting one. We brainstormed ideas about how to work with data and open data to strengthen advocacy in the extractive industries side, with very active participants. They were interested in how they can actually use data to help in their cause for advocacy. The world of data and data usage especially for advocacy in Indonesia is very new, so workshops like this, with the goal of raising awareness of data use among CSOs, are hugely beneficial to the Indonesian community.

Flattr this!

School of Data Goes to MozFest 2014 ! – Part 2

- October 31, 2014 in Data Expeditions, Events

Part 2 of our MozFest recap: check out the first blog post for our Day 1 adventures…

Third Day Recap – Second School of Data Session!

After our first successful session, the School of Data team went in excitedly for the second session on Day 3! The floors were packed in the morning because the organizers made the surprising decision of giving (we think everyone) who attended the Mozilla Festival a Firefox OS Flame phone. A sweet phone, which caused long queues in the Ravensbourne building.

With the sessions now in full steam, the second School of Data session was scheduled in the afternoon, and we brought a familiar School of Data format: that is, the data expedition! The theme for today session is “Analysing Data Using Spreadsheets”, and we went ahead, data sherpa style!

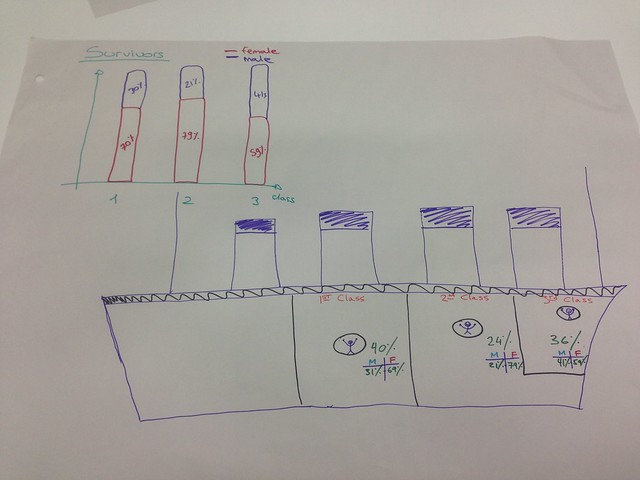
The theme chosen for this data expedition session was all about the re-enacting the Titanic. We provided data on the passengers of the Titanic, and from there we tried to work the data through the familiar School of Data data pipeline. We split the participants into two groups based on the operating system that they use, and then we started hacking! We started by first using a lot of post it notes to try finding questions that we could answer using the data, and after that we used spreadsheet tools such as Excel to find some answers, and last but not least, visualize those answers.

We had an interesting mix of participants in this session, with some them having already worked with spreadsheets a lot, which led to the wonderful situation where participants were teaching with other about various things such as pivot table techniques, formulae, and even the super useful but hard to notice text to column button in Excel (and we also learn new things too) – as following the collaborative learning spirit of Mozilla Festival.

In the end, this is what we made : A visualization of titanic, showing the survival rate of the passengers, separated by gender and passenger class. Really nice expedition :)

School Of Data @ Mozilla Festival London

Flattr this!

School of Data Goes to MozFest 2014 ! – Part 1

- October 31, 2014 in Events

It’s October, which means it’s time for Mozilla Festival! The annual event that is hosted by the Mozilla Foundation is now in its 5th year, and it just keeps getting bigger. The festival took place at Ravensbourne College in London on 24-26 October 2014. Occupying the whole 9 floors of the Ravensbourne building, and with 11 tracks to choose from, the festival this year attracted more than 1600 educators, collaborators, developers, and enthusiasts working towards an open and creative web. This year, the Mozilla Foundation generously supported the School of Data team to conduct sessions regarding data as part of the Science and the Open Web track, which were “Dealing With Messy Data” & “Analyzing Data Using Spreadsheets”. Without giving any too many spoilers away, it was a blast!

First Day Recap – Opening Science Fair

The first day of MozFest was the opening night with the science fair coming in with a full entourage. There was an airblimp, digital guitar, particle shooter and much more! Of course, we had a school of data table at the fair (shown below), together with the Mozilla Science track section and together with the very nice people from the OpenScience.

School Of Data @ Mozilla Festival London

There was a lot of excitement that night, and a lot of people were asking around about the School of Data, and expressed interest in learning data related skills. The team answered all the questions excitedly, and also gave information about School of Data activities including the School of Data fellowship programme, which has taken the School of Data to a whole new international level, with 12 of us fellows operating internationally.

Second Day Recap – First School of Data Session!

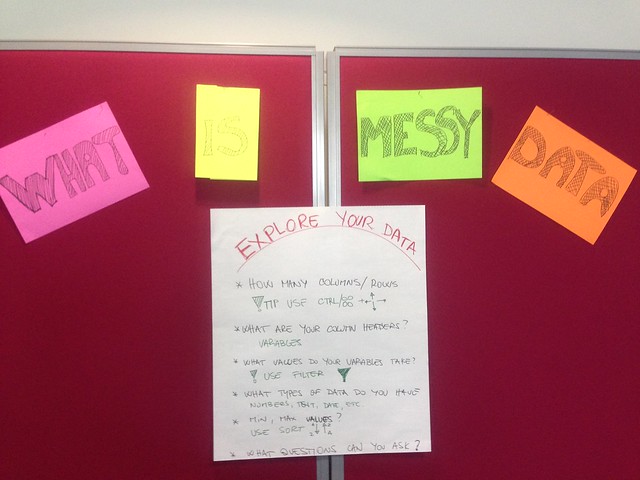
The second day of the Mozilla Festival (which is actually the first “main” session day) started with opening talks. Then, the sessions started in earnest, and we held our first School of Data session at the Mozilla Festival! Our session was in the science track on the 7th floor, and to start with, we did a session titled “Dealing with Messy Data”.

School Of Data @ Mozilla Festival London

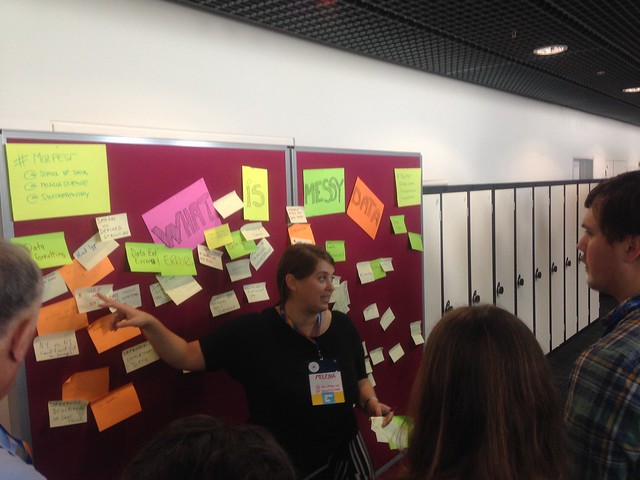
As with the title said, this session is all about messy data. We had about 30 participants in this session, and after some group exercises, we asked questions to the participants, such as: if data were an animal, what kind of animal would it be? A lot of interesting answers came up, including one saying that data was like a mythical beast. Next, we split the participants up into groups, and started hacking on messy data.

First we gave them a dataset (a messy one of course), a lot of post-its, and we gave them time to see what it is that made the data messy. After a lot of post it stacks later, we finally gathered around and made this very nice wall of post it full of messy data elements.

School Of Data @ Mozilla Festival London

With the messy data element properly explained, it was then time to get hands on, technical style with the messy data! True to MozFest collaborative spirit, we got a lot of help from various people such as from Software Carpentry & ROpenScience, so we had about 6 tables, each of which were focusing on a specific technique such as Open Refine, R, Regular Expression, and Python. It was really great and we learned a lot – we hope our participants did too!

But this was just the start of the School of Data team adventure in MozFest;stay tuned for the report of our second session, Analyzing Data via Spreadsheets, in part 2!

Flattr this!