You are browsing the archive for Data Expeditions.

Greek Data Expedition and Data Journalism

- May 26, 2014 in Community, Data Expeditions

[Guest post by Charalampos Bratsas, School of Data, Greece. See more details on the School of Data Greece blog..]

The Open Knowledge Foundation of Greece “OKF Greece” in collaboration with the Masters Program “Web Science Studies” of Mathematics Department and the postgraduate Masters Program “Journalism & New Media” of Journalism & Mass Media Department of Aristotle University of Thessaloniki, presented the first attempted results of writing articles based on data journalism.

Students of both departments, divided into groups, cooperated in order for “Web Science” postgraduate students to seek data, analyze and visualize them, while Journalists processed the available correlations to create a data based article.

Through the aforesaid collaboration three data based articles emerged:

As well, the following infographic was created: “European Student Mobility in the period 2001-2012“.

About Data Journalism

This is a new, promising kind of journalism, which takes advantage of the possibilities offered by new technologies. It uses a variety of different digital data and correlations of information while maintaining the traditional way of tracking issues, highlighting the emerging news and issues that are worthy of publishing.

Further clarifying information can be found in Greek edition of the “Data Journalism Handbook” published by the Open Knowledge Foundation of Greece, the Media Informatics Lab of Journalism & Mass Media Department, and the postgraduate Program in Web Science.

It should be emphasized that the upcoming academic year, data journalism will be taught in the undergraduate curriculum of Journalism & Mass Media Department by Professor Andreas Veglis and Dr. Charalambos Bratsas. Students will have the opportunity to learn the fundamentals, as well as the tools of data journalism, as highlighted in the manual “Data Journalism”.

An example from the session:

European-Student-Mobility

You can stay informed of Open Data topics in Greece on the OKFN Greece website.

Flattr this!

Promoting people-powered accountability beyond 2015

- May 6, 2014 in Data Expeditions

Grant Check

Truly sustainable development can only be achieved if citizens have the knowledge and voice to shape priorities, air grievances and hold governments to account. As we approach a new set of development goals post-2015, civil society organisations across the world are identifying how best to support new information technologies and innovative forms of citizen reporting, enabling them to monitor progress and to hold governments to account for the promises they make.

CIVICUS, Open Knowledge Foundation’s School of Data and the engine room recently hosted a data expedition (an event to tackle a problem, answer a question or work on a project) on citizen-generated corruption data. The event brought together a wide variety of civil society actors and IT experts for a hands-on exercise in working with different datasets from NGOs and governments. The aim was to delve into the data in order to understand the challenges and opportunities of comparability between existing forms of citizen monitoring mechanisms. Participants also shared their challenges, experiences and tools for gathering, merging and analysing open data.

Some interesting observations resulted from the expedition:

  • Knowing the story you are trying to tell will greatly help determine what data you want.
  • Policy makers are crucial for establishing common data standards and donors should impose existing standards (such as the International Aid Transparency Initiative) on their fund recipients so that aid data from different countries can be better aggregated.
  • A serious need for more citizen feedback was identified. This data is crucial for monitoring impact and success of development projects.

Integrity Action shared innovative tools for gathering verifiable citizen feedback and also for accurately tracking funding flows in compliance with international standards at the workshop:

GrantCheck is an online resource that gives donors, grantees and citizens full insight into funding flows and where their money goes. It gives grantees visibility and helps them meet high standards of transparency and accountability by providing useful mapping and reporting. GrantCheck is an effort to generate the full picture of funding flows and verify this data by engaging donors and their recipients to check and verify its accuracy. Follow the money with us!

DevelopmentCheck is an online tool for citizen feedback on development projects. Community monitors collect data on the transparency, participation and effectiveness of development projects and share their findings. The tool is available as a mobile app allowing real-time citizen feedback. Check out how projects across sectors in Africa, Asia and the Middle East are doing!

Integrity Action’s vision is to link these tools in order to provide a full picture of funding from the source to citizen feedback so that ultimately citizens get access to better services.

Join the conversation! Tell us:

  • How do you engage and incentivise citizens to provide feedback?
  • How do you verify the accuracy of the data you use?
  • Do you have a story you want to tell but lack the data to do so?

We would love to hear your answers: [email protected]

Flattr this!

Comparing Corruption Data: expedition in London on April 2nd, 2014

- March 26, 2014 in Data Expeditions

School of Data is organizing a corruption data expedition in London next Tuesday, together with the engine room and CIVICUS World Alliance.

The expedition will involve teams wrangling, scraping and analyzing different kinds of corruption data collected by civil society (everything from citizen reports, to representative surveys to web-scraped data) and looking for ways to piece them together for better data-driven advocacy. We’ve got space for up to 25 people, and will be running on Wednesday April 2nd, 9:30AM until 4:30PM at C4CC, near King’s Cross. You can find more information in this concept note; for background on CIVICUS work to support citizen data for accountability, click here.

You can also register on this form.

If you’re in London next week and interested in anti-corruption campaigning or want to flex datawrangling muscles, sharpen dataskills and mash up for the greater good, join us!

Flattr this!

Mapping company network in the Nigerian extractive industry

- December 23, 2013 in Data Expeditions

On December 7 data wranglers, maptivists and arm chair researchers got together for an online Data Expedition to analyse the Nigerian extractive industry in a collaboration between School of Data, African Media Initiative and OpenOil. More than 30 participants checked into the Unhangout, took part in one of the three teams and joined trainings on mapping. session wherefrom presentations and trainings where conducted.
Below you will find some of the results from the amazing work that the teams pulled off on the day and during the following days to unlock data from the explored corners of pipelines and company registrations within the oil contractors in Nigeria.

###Investigating the corporate networks in Nigeria’s oil industry
A team of dedicated researchers collected data on more than 100 companies within the corporate supply chain of the oil industry contributing to a Gephi network visualisation (image below). The network analysis shows how companies in the extractives sector are connected based on contracts and ownership and thanks to the team the network expanded substantially during the expedition leaving a model for future research.

Gephi-oil-network

In another company analysis project Khadija Sharife, an investigative journalist from African Media Initiative, collected a list of oil rigs operating off-shore in Nigeria.

###Mapping the pipelines and other parts of the oil infrastructure
Another team headed up an exercise to map essential elements of the oil infrastructure in 12 of the highest producing concession areas operated by Big Oil. Participants traced water basins located near oil drills, pipelines and other items which could be identified from satellite imagery. The map below below shows the annotations completed during the expedition.

View Nigeria Onshore Concessions – First Round in a larger map

###Analysing the revenues from oil
The third team conducted an analysis of the government revenues from the oil industry and its impact on the Nigerian budget. Participants started out by reviewing the complex revenue flows, oil terminology and revenue data available from the Nigeria country report to the Extractive Industries Transparency Initiative. As part of the work on revenue analysis Heather Leson headed up some data collection of the Canadian extractive industry and its interests in Nigeria. The team extracted data on Nigeria’s oil and gas revenues from 2009-2011 from the 2012 NEITI report and ended up with this treemap.

You can find all the their notes in this team scratch pad.

Flattr this!

Data Journalism BootCamp in Moldova

- December 2, 2013 in Data Expeditions

After meeting the government and civil society organisations in Moldova, we participated in a data journalism boot camp organised by our friends from the UNDP, where we led a spreadsheets training and a data expedition exploring education in Moldova.

The participants were young journalists from Moldova but also Eastern Europe, Caucasus and Central Asia. We had a good mix between students and practitioners, various levels of experience in working with data and an immense appetite across the board to learn how to use data effectively.

The boot camp provided a great framing for data journalism including some theoretical aspects regarding legislation and how to get data through the Freedom of Information Laws, some amazing examples of applications and stories using data such as the Budget Stories project put together by the Expert Group in Moldova, and finally some training on data analysis and visualisation culminating with a hands-on data expedition exploring education data in Moldova.

IMG_1756

##Data analysis and visualisation

Before diving into visualization tools and tips, we wanted to make sure all participants are well equipped to make basic analysis with spreadsheets. We refreshed together basic skills such as sorting, filtering, basic formulas and pivot tables. Then we moved into showcasing some visualization tools such as Data Wrapper, Fusion tables, Raw, Infogr.am, etc. Find the presentation here.

##Data expedition: education in Moldova

In the second day of the boot camp, we finally got to put all the skills into practice during a data expedition. We immediately split in three smaller groups on the basis of the participants’ experience: the advanced group led by Michael got to nerd around with APIs and Open Refine; the second group led by our friend Crina Boros, Data Journalists at Thomson Reuters Foundation, created their first maps with Fusion Tables, and the last group got to practice pivot tables and visualisation tools exploring the ethnicity of students in Moldova.

In trying to explore whether schools in Moldova encourage rather integration or segregation, we discovered that the schools with most ethnic minorities are found in cities, especially Chisinau, Vulcanesti or Balti.

Moldova schools

Flattr this!

Data Expedition, December 7: Investigate the Extractive Industries of Nigeria

- November 15, 2013 in Data Expeditions

The data expedition described on this post is over. For more recent data expedition announcements, visit the blog.

20131022-DSC_3409


Who operates the often poisonous wells in the Niger Delta? How does the money flow between the contractors running the oil fields and the government?

Join us for an online Data Expedition to Investigate the Extractive Industries of Nigeria December 7, Noon-18:00 CET / Lagos.

Register for free

###The problem: Companies hide in plain sight
Data on the extractives industry is increasingly going public, from EITI‘s information about money flows from companies to governments to the UK’s decision to make its register of the beneficial owners of private companies public in the future. As more information about the oil, gas and mining industries makes it into the public domain, more people living in resource-rich countries have the potential to benefit. Information transparency can lead to greater public scrutiny of these industries that affect so many lives. Databases such as OpenCorporates are rapidly expanding and making companies involved in extractives and other industries easier to trace. Meanwhile, other data published in local media or tucked away in companies’ annual reports has seemingly been hiding in plain sight for years.

###What are we going to do?
We want to begin cracking this data open and analysing it to facilitate investigations by journalists, organisations, activists and governments who all need to know how extractives impact people’s lives. In collaboration with OpenOil and African Media Initiative, School of Data will bring together those with an interest in learning to work with data to help tackle some of the biggest issues in the extractive industries today, with a focus on Nigeria. The Data Expedition will complement our recently launched Follow the Money network, which pushes for the transparency needed to help citizens around the world use information about public money to hold decision-makers to account.

###What will you learn?
– Network analysis: Investigate the corporate supply chain in Nigeria’s oil industry by using networks to see who is connected to whom
– Corporate research: Cut through generic names like “Shell” and “Exxon” to identify the specific corporate vehicles responsible for activities in places such as the Niger Delta
– Mapping: Work with maps of geo-coded oil spills, company license areas and other data to draw connections that might not be apparent in text-based media
– Web-scraping: Find company data and establish leads for other investigations related to the oil industry by scraping the web

To join the Data Expedition register in the form below!

Flattr this!

Civic tech in the Balkans

- November 13, 2013 in Data Expeditions

1471380_534198600003029_1861051442_n

Last week the Community Boost_r program brought together information and technology activists from Eastern Europe in an un-conference style tech camp in Sarajevo. The camp featured two days packed with workshops and plenty of opportunity to nerd around. Milena and Michael were there for School of Data to run a data expedition and give a hands-on introduction into data-cleaning with Refine.

##Investigating election data in Montenegro and Bosnia
The first session we organized was a data expedition. Since elections are a hot topic in the region, we chose to work on two interesting datasets: one from Bosnian local elections and one from presidential and parliamentary elections in Montenegro. We worked in small looking at the different data we had.

The first group looked at a dataset of local elections in Bosnia obtained via FOIA by OneWorld SEE and containg detailed data on all candidates for the past 3 local elections (2004, 2008 and 2012). After a quick look at the data, the group decided to focus on 2 issues: gender representation and the degree to which the same candidates run for office several times. In the gender group we quickly realised there is a 33% compulsory quota of women candidates which all parties strictly abide by. However, only 5% of women candidates end up being elected. But the most interesting thing in the data was the little variation over year and parties – it was almost like there was a mastermind engineering the data.

Table 2

This mathematical precision showed up also when we tried to analyse on which positions are women more likely to be placed on a list. With no variation across political parties or years, it seems like women are overwhelmingly placed on positions 2, 5, 8 and 11 and of course few of them are candidates for mayor positions: 6% of total candidates and only 3% of elected mayors.

Over in the Montenegro group the participants quickly decided on wanting to do cluster-analysis of the existing data – to find clusters of districts that vote similarly. They found a quite strong difference between voting patterns in Podgorica and the rest of the country: rural to urban differences seem to be the cause here.

##Cleaning Data with Refine – hands on

Thanks to having too many ideas when asked out on an event we planned a session on Data cleaning with Refine for the second day. As this is a quite nerdy topic you can’t expect too many people when at the same time sessions discuss how to kick your local governments seating muscles. Nevertheless, a small, engaged crowd of people showed up and we took them through cleaning a dataset of bosnian tender information. (Walkthroughs available here). On the way through the workshop we took a small detour through regular expressions – a very handy special expression language to search text for specific patterns.

What we’ve learned

Besides the oddities of the election system in Bosnia and Herzegovina we met a large group of people involved in improving the communication of their citizens with municipal, local and federal governments. While the patterns seem very similar – the projects tend to replicate similar projects over and over again. A problem that seems to be slowly recognized in the community. The same is true for data: while some projects aim to bring together various civil society organizations to share their data – many start building their own codebase. We need to start sharing! If we work together collaboratively, we can achieve so much more.

Flattr this!

Mapping public finances in Nigeria

- November 13, 2013 in Data Expeditions, Data for CSOs

NigeriaBudget

On October 10 School of Data ran a Data Expedition at the OpenGov Hub in Washington DC to explore the public contracts and finances in Nigeria. The Data Expedition was organised in collaboration with BudgIT in Nigeria: an organisation which promotes awareness about Nigeria’s finances through data driven campaigning.

###Tracing government revenue flows
data-expedition-with-DFID

Participants at the expedition took a closer look at the complex public finances of Nigeria. Revenues from ordinary taxes as well as the extractive industry are channeled through a multiplicity of entities inside the government. Isabel Munilla led a attempt to draft a flow chart of how Nigerian revenues might be administered and steered through the government (image above).

###Mapping government contracts
Participants also decided to  investigate how federal Nigerian contracts are distributed by government departments and to which companies they are directed. The procurement data was scraped from PDF-format by BudgIT in Lagos and coded according to budget classifications, while participants at the OpenGov Hub geocoded the contracts based on locations where work and services were planned to be delivered. The geo-coding process resulted in a map of the distribution of government contracts (image at top).

The data cleaning and formatting of the procurement data also enabled the team to add it to OpenSpending. It turned out that a sizeable share of the more than 300 contracts were awarded by the Nigerian Ministry of Petroleum Resources. Many of these contracts relate to public school projects in oil rich areas as an outcome of large oil drilling contracts.

The Data Expedition was supported by the Department for International Development (UK) and concluded with presentations for members of the Steering Committee of the Global Partnership for Effective Development Co-operation. The presentations were finally followed up by a discussion about the benefits of open data in development.

Flattr this!

Data Expedition at Open Development Camp

- November 8, 2013 in Data Expeditions

Somalia Famine Food Aid Stolen / Human Black Hole

Photo credit: Surian Soosay

Our challenge: give Open Development a reality check at Open for Change’s Open Development Camp in Amsterdam.

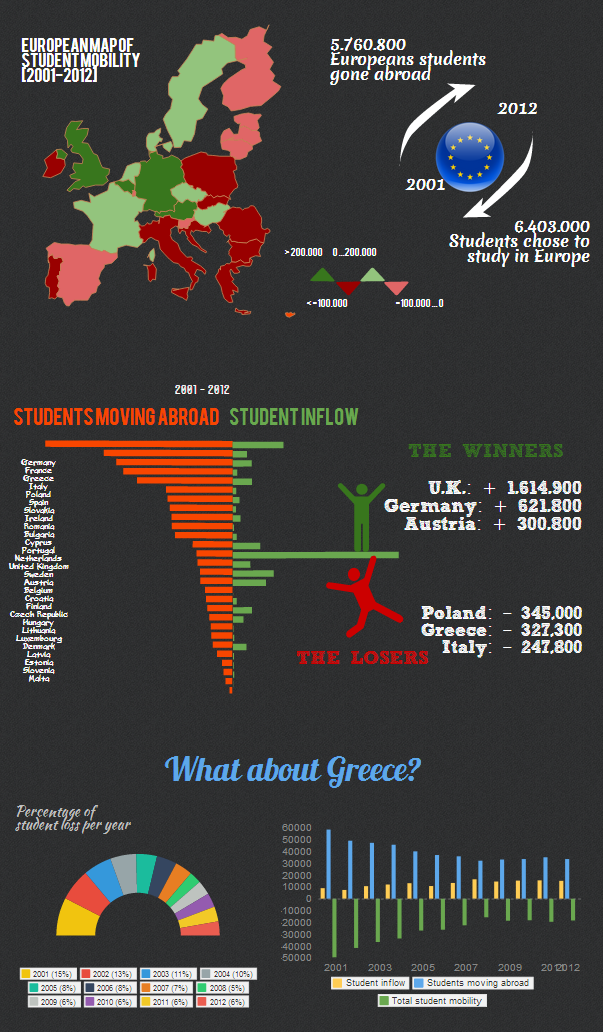
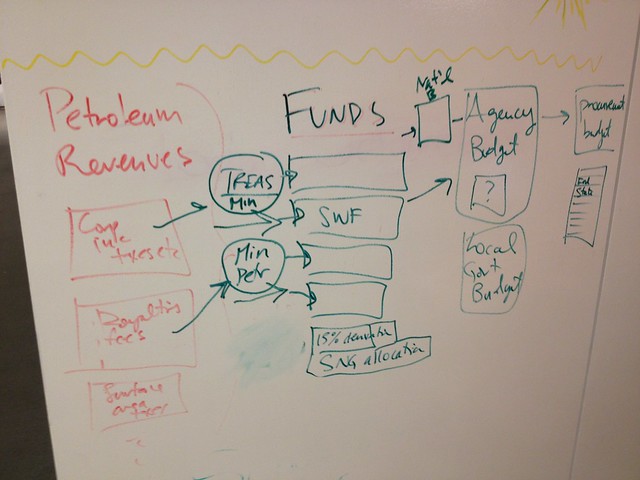
This challenge was well and truly accepted by participants of the Open Development Camp during this afternoon’s Data Expedition, led by myself and my colleague Katelyn Rogers. We started with the very broad theme of looking into bilateral aid flows, following recent articles on how OECD countries were thinking of redefining rules of what counted as ‘aid’ and a report by Development Initiatives which revealed that a fifth of OECD aid never leaves the donor country.

The group, made up of around 20 people, split into four groups.

The first looked into remittances flowing into Somalia, and they found data from the World Bank on remittances. They found that the Guardian had the best data set on this but that the column for Somalia (along with a couple of other countries) was entirely empty. They then found the data hidden deep in a PDF and used everyone’s favourite PDF extraction tool, Tabula, to extract this data.

The second group chose a trickier topic: taking a dive into project failures. Is the phrase ‘learn from your mistakes’ even possible in the development world? Do we know where projects might have stopped just after the pilot, whether projects benefited from planning research, or could it be that every single project is a success?

While I don’t think any of us believed that last suggestion, it soon became clear that project failures simply aren’t documented. One participant mentioned a past initiative from the Canadian International Development Agency which invited people to record their project ‘challenges’, but as there were only four even recorded, we didn’t consider that to be of much help. It did, however, lead to many interesting discussions around what success actually is for a development project (who decides, donor or recipient?) and how these criteria are set.

The third group looked at the Dutch Foreign Ministry’s open data site, OpenAid.nl, to see where money was going from the Netherlands. While it turned out that Afghanistan is the biggest recipient of aid money, it proved difficult to find the budget data of the Dutch Foreign Ministry (though we were later informed that it is in fact on the site somewhere).

The fourth group took a much more specific route to looking at international aid flows, focusing on the issue of tuberculosis. The challenge: does expenditure on prevention of tuberculosis have any correlation to prevalence of tuberculosis?

The first step proved fairly easy: the World Health Organisation provides detailed data on the prevalence of tuberculosis per 100,000 people dating back some 20 years. Great! But what about the financing? Unfortunately, it turns out that the World Health Organisation only provides PDFs on the amount of money that was spent on this per country; and not just that, but the data is already processed into bar charts, meaning that we couldn’t even scrape the PDF for that data.

We didn’t let that stop us, though. We focused on the country PDF profile of Bangladesh, as we wanted a country that hadn’t experienced serious conflict in the last 10 years to avoid extra external factors. Using the Chrome Extension MeasureIt to make a crude estimate of how big the bars were in the bar chart on the country profile, we recorded our estimates in a spreadsheet and plotted the line of spending on tuberculosis against the prevalence of tuberculosis in the country.

We discovered that, for some reason, funds available for treating tuberculosis in Bangladesh tripled between 2009 and 2010. Aside from this making planning incredibly difficult, it actually had no effect whatsoever on the prevalence of tuberculosis, which has been declining fairly steadily in the country for the past 20 years.

So—expedition success! We learned about Tabula, about how to find your way around the IATI data store, how to get data even if someone out there really doesn’t want you to have it (ie. by measuring pixels of a bar chart!), and that there is a gap in measuring success of development projects, to name just a few findings.

Thanks, everyone; we hope you enjoyed it as much as we did!

Flattr this!

Findings of the investigation of garment factories of Bangladesh

- October 29, 2013 in Community, Data Expeditions, Data Stories

BANGLADESH-BUILDING/

Credit: Weronika (Flickr) – Some rights reserved.


Connecting the Dots: Mapping the Bangladesh Garment Industry

This post was written in collaboration with Matt Fullerton.

During the weekend of October 18th-October 20th, a group of volunteers, data-wranglers, geo-coders, and activists teamed up with the International Labor Rights Forum and P2PU for a Data Expedition to investigate the Garment Factories. We set out to connect the dots between Bangladeshi garment producers and the clothes that you purchase from the shelves of the world’s largest retailers.

Open Knowledge Foundation Egypt and Open Knowledge Foundation Brasil ran onsite Data Expeditions on garment factories and coordinated with the global investigation.

In previous endeavors, School of Data had examined the deadly history of incidents in garment factories in Bangladesh and the location of popular retailers’ clothing production facilities. This time around, we worked draw the connections between the retailers that sell our clothes, the factories that make it, the safety agreements they’ve signed, the safety of those buildings, and the workers who occupy them day and night.

Sources of Bangladeshi Garment Data

The Importance of the Garment Industry In Bangladesh

Bangladesh, as many people are aware, is a major provider of garment manufacturing services and the industry is vital to Bangladesh’s economy, accounting for over 75% of the country’s exports and 17% of the country’s GDP. As in many developing countries, conditions can be harsh with long hours and unsafe working conditions. This project seeks to provide a resource which can then be used to drive accountability for these conditions and improve the lives and livelihood of average garment worker.

What’s Being Done

Many organisations and agreements already seek to promote the garment industry in Bangladesh and to ensure worker health and safety (Bangladesh Garment Manufacturers and Exporters Association (BGMEA), Bangladesh Safety Accord, Alliance for Bangladesh Worker Safety, International Labor Rights Forum (ILRF), Clean Clothes Campaign (CCC), Fair Wear Foundation, The Solidarity Center). Collectively, these groups provide a range of data on Bangladeshi Garment factories: where they are located, safety incidents, and what retailers the factories supply. Our goal focused on connecting suppliers to sellers within the datasets, and geographically plotting the results on an interactive map. Ultimately, we seek to create a usable tool that is filterable on several criteria, specifically on membership to the various organisations and safety agreements which exist, the factory incident history, and the retailers that are being supplied by these factories. Styling of point radii would allow a quick overview of e.g. the number of workers and pop-up information could include additional data from the certification and auditing data including addresses, contact information, website addresses, incidents, and many more.

We made significant progress at the Data Expedition of October 20-21 as we:

Keep Moving Forward

We however do not want to stop here. Rather, we see this as simply the beginning of a longer international collaborative project to make it possible for you to find out who created your clothing and under what conditions.

Get involved in the continued investigation of the garment factories by:

Flattr this!